
Brocade Web Tools Administrator's Guide - Supporting Fabric OS v5.3.0 (53-1000435-01, June 2007)


50 Web Tools Administrator’s Guide
Publication Number: 53-1000435-01
Monitoring events
3
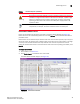
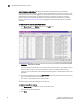
You can click the column head to sort the events by a particular column, and drag the column
divider to resize a column. You can also right-click a column heading to resize one or all
columns, sort the information in ascending or descending order, or choose which columns are
displayed.
You can also filter events, as described in “Filtering Fabric and Switch Events” on page 51.
DISPLAYING SWITCH EVENTS
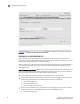
The Switch Events tab displays a running log of events for the selected switch (see Figure 26 on
page 50). Switch events are polled and updated every 15 seconds, so there is no
refresh-on-demand option for switch events, as there is for the fabric events.
For two-switch configurations, all chassis-related events are displayed in the event list of each
logical switch for convenience.
To display switch events
1. Click the switch from the Fabric Tree.
The Switch View appears.
2. Click the Switch Events tab, if necessary.
FIGURE 26 Switch Events tab