
Brocade Web Tools Administrator's Guide v6.0.0 (53-1000606-01, April 2008)

46 Web Tools Administrator’s Guide
53-1000606-01
Monitoring events
3
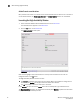
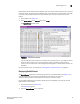
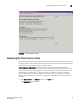
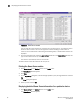
FIGURE 25 Switch Events tab
You can click the column head to sort the events by a particular column, and drag the column
divider to resize a column. You can also right-click a column heading to resize one or all
columns, sort the information in ascending or descending order, or choose which columns are
displayed.
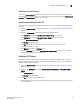
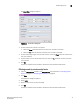
Filtering Fabric and Switch Events
You can filter the fabric and switch events by time, severity, message ID, and service. You can apply
either one type of filter at a time or multiple types of filters at the same time. Click the Filter button
to display the Event Filter dialog box (see Figure 26 on page 47).
When a filter is applied, the filter information appears at the bottom of the filtered information and
the Show All link is available to allow you to view the information unfiltered.
NOTE
For two-switch configurations, click the Events button for a given switch to automatically filter out the
switch service events from the other switch. Chassis service is shown in both events lists.
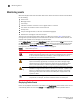
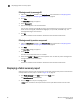
1. Open the Fabric Events window or the Switch Events tab as described in “Displaying Fabric
Events” on page 44 or “Displaying Switch Events” on page 45.
2. Click Filter.