
Brocade Web Tools Administrator's Guide v6.0.0 (53-1000606-01, April 2008)
48 Web Tools Administrator’s Guide
53-1000606-01
Displaying a fabric summary report
3
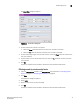
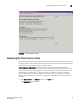
Filtering events by message ID
1. Open the Fabric Events window or the Switch Events tab as described in “Displaying Fabric
Events” on page 44 or “Displaying Switch Events” on page 45.
2. Click Filter.
The Event Filter dialog box appears.
3. Select Message ID.
4. Type the message IDs in the associated field.
You can enter multiple message IDs as long as you separate them by commas. You can type
either the full message ID (moduleID-messageType) or a partial ID (moduleID only). The
message ID filtering is case-sensitive.
5. Click OK.
The filter is enabled and the window is refreshed to show the filtered information.
Filtering events by service component
1. Open the Fabric Events window or the Switch Events tab as described in “Displaying Fabric
Events” on page 44 or “Displaying Switch Events” on page 45.
2. Click Filter.
The Event Filter dialog box appears.
3. Check Service.
The event service drop-down menu is enabled.
4. Select either Switch or Chassis from the drop-down menu to show only those messages from
the logical switch or from the chassis.
5. Click OK.
The filter is enabled and the window is refreshed to show the filtered information.
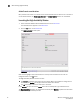
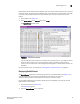
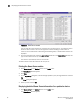
Displaying a fabric summary report
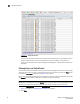
A fabric summary report lists all of the domains in the fabric and the active paths for each domain.
A sample fabric summary report is shown in Figure 27 on page 49.
1. Click Fabric Summary in the Other section of the Tasks menu.
The Fabric Summary window appears.
2. Click the Print button to print a topology report.
A Print button is located at the top and bottom of the report. Both buttons have the same
function.