
HP StorageWorks Fabric OS 5.0.0 Advanced Web Tools User Guide (AA-RW1RA-TE, May 2005)


Fabric OS 5.0.0 Advanced Web Tools user guide 119
The labeling of axes in the graphs depends on the switch type. For the Core Switch 2/64 and SAN
Director 2/128, slot numbers are displayed with expandable arrows next to them. Click the arrows to
expand and contract the list of ports per slot. For the SAN Switch 2/8V, SAN Switch 2/16V, SAN Switch
2/32, and SAN Switch 4/32 slot numbers are not identified.
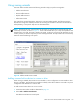
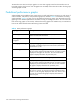
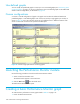
Figure 39 shows how to access the list of Advanced Performance Monitoring graphs using Advanced
Web Tools. This example displays the graphs available in the Performance Monitor module for a SAN
Director 2/128 with the Advanced Performance Monitoring license installed. Note that the slot number is
identified.
Figure 39 Accessing performance graphs
Table 9 Advanced performance monitoring graphs
Graph type Description
SID/DID Performance Displays the traffic between the SID-DID pair on the switch being
managed. For more information, see ”Creating an SID/DID
performance graph” on page 123.
SCSI vs. IP Traffic Displays percentage of SCSI versus IP frame traffic on each
individual port. For more information, see ”Creating a SCSI vs.
IP traffic graph” on page 124.
AL_PA Errors Displays CRC errors for a given port and a given AL_PA. For
more information, see ”Creating an AL_PA error graph” on
page 125.
SCSI Commands by port and
LUN (R, W, R/W)
Displays the total number of read/write commands on a given
port to a specific LUN. For more information, see ”Creating a
SCSI command graph” on page 124.