
HP StorageWorks Fabric OS 5.0.0 Advanced Web Tools User Guide (AA-RW1RA-TE, May 2005)


120 Performance monitoring administration
User-defined graphs
You can modify the predefined graphs to create your own customized graphs (see ”Customizing basic
monitoring graphs” on page 121 for more information). These user-defined graphs can be added and
saved to canvas configurations, as described on page 126.
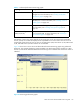
Canvas configurations
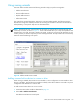
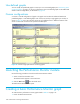
A canvas is a saved configuration of graphs. The graphs can be either the Advanced Web Tools
predefined graphs or user-defined graphs. Each canvas can hold up to eight graphs per window, as
shown in Figure 40. Up to 20 canvases can be set up for different users or different scenarios. Each
canvas is saved with a name and an optional brief description.
Figure 40 Canvas of eight performance monitoring graphs
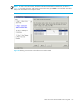
Launching the Performance Monitor module
Use the following procedure to launch the Performance Monitor module:
1. Select a switch from the Fabric Tree.
The selected switch appears in the Switch View.
2. Click the Perf button from the Switch View.
The Performance Monitor module opens.
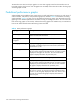
Creating a basic Performance Monitor graph
To create the basic performance monitor graphs listed in Table 8 on page 118:
1. Launch the Performance Monitor.