
HP StorageWorks Fabric OS 5.0.0 Advanced Web Tools User Guide (AA-RW1RA-TE, May 2005)


Fabric OS 5.0.0 Advanced Web Tools user guide 123
Creating advanced performance monitoring graphs
You can create the advanced performance monitor graphs listed in Table 9. Because the procedure for
creating these graphs differs depending on the type of graph, each type is described separately in the
sections that follow.
NOTE: You must have an Advanced Performance Monitoring license installed to use the Advance
Performance Monitor features.
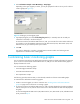
Creating an SID/DID performance graph
The SID/DID performance graph displays the traffic between a SID/DID pair on the switch being
managed. To create a SID/DID performance graph:
1. Launch the Performance Monitor module as described on page 120.
2. Select Performance Graphs > Advanced Monitoring > SID/DID Performance.
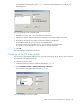
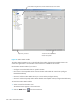
The SID/DID Performance Setup dialog box opens (Figure 43).
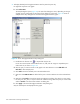
If you want to see which end-to-end (EE) monitors are currently set up on a particular port, proceed to
step 3.
If you want to specify the port, source ID, and domain ID, skip to step 4.
Figure 43 Creating an SID/DID performance graph
3. Click a port from the Slot/Port or Sid/Did Selection List.
a. Drag the selected port into the Enter/drag port number field.
b. Click Retrieve preset EE monitors.