
HP StorageWorks Fabric OS 5.0.0 Advanced Web Tools User Guide (AA-RW1RA-TE, May 2005)


126 Performance monitoring administration
3. Navigate to a switch > slot > port in the Slot/Port or Alpa Selection List.
4. Click the port from the Slot/Port Selection List or an AL_PA from the Slot/Port Selection List, and drag it
into the Enter/drag slot,port field. You can also manually type the slot and port number, in the format
slot,port.
5. Click OK.
The AL_PA error graph appears on the canvas.
Managing performance graphs
This section provides the following procedures for managing performance graphs:
• Adding a graph to an existing canvas, page 126
• Saving graphs to a canvas, page 126
• Printing graphs, page 127
• Modifying an existing graph, page 127
Adding a graph to an existing canvas
The following procedure assumes that a canvas is already created.
To create a new canvas, you must first create graphs, as described in ”Creating a basic Performance
Monitor graph” on page 120 and ”Creating advanced performance monitoring graphs” on page 123,
and then save those graphs to a canvas, as described in ”Saving graphs to a canvas” on page 126.
To add a graph to an existing canvas:
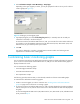
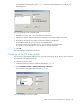
1. Select File > Display Canvas Configurations.
The Canvas Configuration List opens. The message No Canvas configuration to display is
displayed if there are no saved canvas configurations.
2. Click a canvas in the list.
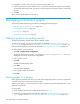
3. Click Edit.
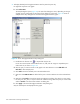
The Edit Canvas dialog box opens.
4. Click Add.
A list of graphs is displayed.
5. Click a graph to add it to the canvas.
6. Click Save.
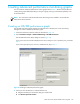
Saving graphs to a canvas
Saving graphs is especially useful when you create customized graphs and do not want to re-create them
every time you access the Performance Monitor module.
When you save graphs, you must save them to a canvas. The following procedure describes how to save
graphs to a new canvas.
To save graphs:
1. Launch the Performance Monitor module as described on page 120.
2. Create basic or advanced Performance Monitor graphs (see ”Creating a basic Performance Monitor
graph” on page 120 and ”Creating advanced performance monitoring graphs” on page 123).