
HP StorageWorks Fabric OS 5.0.0 Advanced Web Tools User Guide (AA-RW1RA-TE, May 2005)

Fabric OS 5.0.0 Advanced Web Tools user guide 127
The graphs are displayed in the in the Performance Monitor window.
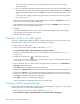
3. Select File > Save Current Canvas Configuration.
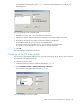
The Save Canvas Configuration dialog box opens.
4. Type a name and description for the configuration and then click Save Canvas.
A message appears, confirming that the configuration was successfully saved to the switch.
Printing graphs
You can print a single graph or all the graphs displayed on the selected canvas configuration. Only one
canvas configuration can be opened at a time.
To print a single graph:
1. Launch the Performance Monitor module as described on page 120.
2. Create a basic or advanced Performance Monitor graph (see ”Creating a basic Performance Monitor
graph” on page 120 and ”Creating advanced performance monitoring graphs” on page 123).
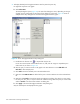
3. Right-click anywhere in the graph and click Print.
The print dialog box opens.
4. Click OK.
To print all graphs in a canvas:
1. Launch the Performance Monitor module as described on page 120.
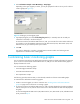
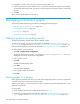
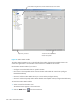
2. Select File > Display Canvas Configurations.
The Canvas Configuration List appears. The message No Canvas configuration to display
appears if there are no saved canvas configurations.
3. Select a canvas from the list and click Load.
The graphs from that canvas are displayed in the Performance Monitor window.
4. Select File > Print All Graphs.
The print dialog box opens.
5. Click OK.
Modifying an existing graph
Use the following procedure to modify an existing graph that is saved in a canvas:
1. Launch the Performance Monitor module as described on page 120.
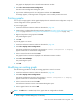
2. Select File > Display Canvas Configurations.
The Canvas Configuration List opens. The message No Canvas configuration to display
appears if there are no saved canvas configurations.
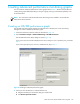
3. Select a canvas from the list and click Edit.
The Performance Monitor Canvas: Canvas Name dialog box opens.
4. Select a graph from the list and click Edit.
NOTE: The Edit button is enabled only for the graphs that are configurable or editable.
5. Make changes in the Edit dialog box, as necessary.