
HP StorageWorks Fabric OS 5.0.0 Advanced Web Tools User Guide (AA-RW1RA-TE, May 2005)

Fabric OS 5.0.0 Advanced Web Tools 79
4 Monitoring your fabrics, switches,
and ports
This chapter contains the following sections:
• Monitoring events, page 79
• Displaying a fabric topology report, page 84
• Displaying the name server entries, page 85
• Displaying switch information, page 87
• Physically locating a switch using beaconing, page 90
• Displaying port information, page 90
• Displaying swapped port area IDs, page 92
Monitoring events
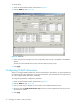
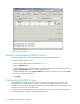
Advanced Web Tools displays fabric-wide and switch-wide events. Event information includes sortable
fields for the following:
• Switch name
• Message number
• Time stamp
• Indication whether the event is from a logical switch or a chassis
• Severity level
• Unique message identifier (in the form moduleID-messageType)
• Detailed error message for root cause analysis
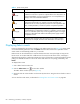
There are four message severity levels: Critical, Error, Warning, and Info. Table 7 lists the event message
severity levels displayed in the Switch Event and Fabric Events views, and describes the characteristics of
each level.
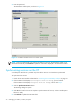
In both the Switch Events view and the Fabric Events view, you can click the Filter button to open the Filter
Events dialog box. The Filter Events dialog box allows you to define which events should be displayed in
the Switch Events view or Fabric Events view. For more information on filtering events, refer to ”Filtering
fabric and switch events” on page 82.