
HP StorageWorks Fabric OS 5.0.0 Fabric Watch User Guide (AA-RW1TA-TE, May 2005)
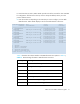
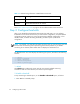
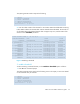
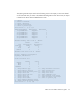
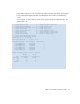
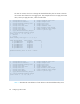
Table Of Contents
- Contents
- About this guide
- An introduction to Fabric Watch
- Fabric Watch concepts
- Fabric watch components
- Configuring events
- Port persistence
- Notification methods
- Switch policies
- Interpreting event messages
- Activating and accessing Fabric Watch
- Configuring Fabric Watch
- Configuring Fabric Watch thresholds
- Configuring notifications
- Configuring switch status policy
- Configuring FRUs
- Configuring Fabric Watch using Web Tools
- Configuring Fabric Watch using SNMP
- Generating Fabric Watch reports
- Default threshold values
- Basic Fabric Watch configuration guidelines
- Using Fabric Watch with configuration files
- Glossary
- Index

Configuring Fabric Watch54
The numerical values shown in between the brackets (in this case, 8-29) correspond to the
index numbers of the elements within the area. The first element is always selected by default.
2. Enter the index number of the element for which Fabric Watch should enable monitoring.
Fabric Watch redraws the element table with the selected element enabled. A second row of
information about the selected element appears, and the status of the element is set to
enabled.
4. advanced configuration
To customize Fabric Watch monitoring to suit to your environment, use the advanced
configuration option as follows:
1. Enter 4 at the command prompt.
Select threshold index => : (8..29) [8] 8
Index ThresholdName Port CurVal Status
LastEvent LasteventTime LastVal LastState
================================================================================
8 eportRXPerf008 8 0 Percentage(%)/min enabled
inBetween Wed Aug 25 01:01:05 2004 0 Percentage(%)/min Informative
17 eportRXPerf017 7 0 Percentage(%)/min enabled
inBetween Wed Aug 25 01:01:05 2004 0 Percentage(%)/min Informative
26 eportRXPerf026 26 0 Percentage(%)/min enabled
inBetween Wed Aug 25 01:01:11 2004 0 Percentage(%)/min Informative
27 eportRXPerf027 27 0 Percentage(%)/min enabled
inBetween Wed Aug 25 01:01:11 2004 0 Percentage(%)/min Informative
28 eportRXPerf028 28 0 Percentage(%)/min enabled
inBetween Wed Aug 25 01:01:11 2004 0 Percentage(%)/min Informative
29 eportRXPerf029 29 0 Percentage(%)/min enabled
inBetween Wed Aug 25 01:01:11 2004 0 Percentage(%)/min Informative