
HP StorageWorks Fabric OS 5.0.0 Fabric Watch User Guide (AA-RW1TA-TE, May 2005)
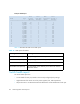
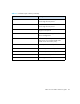

Table Of Contents
- Contents
- About this guide
- An introduction to Fabric Watch
- Fabric Watch concepts
- Fabric watch components
- Configuring events
- Port persistence
- Notification methods
- Switch policies
- Interpreting event messages
- Activating and accessing Fabric Watch
- Configuring Fabric Watch
- Configuring Fabric Watch thresholds
- Configuring notifications
- Configuring switch status policy
- Configuring FRUs
- Configuring Fabric Watch using Web Tools
- Configuring Fabric Watch using SNMP
- Generating Fabric Watch reports
- Default threshold values
- Basic Fabric Watch configuration guidelines
- Using Fabric Watch with configuration files
- Glossary
- Index

81Fabric OS 5.0.0 Fabric Watch user guide
5 Generating Fabric Watch reports
This chapter describes the basic Fabric Watch reports that you can generate through a telnet
connection or by using Advanced Web Tools. This chapter contains the following sections:
• Types of Fabric Watch reports, page 81
• Viewing Fabric Watch reports, page 86
Types of Fabric Watch reports
You can run reporting commands in Fabric Watch to get instant access to switch information.
Although the switchShow command provides basic switch information, the Fabric Watch
reports provide detailed information and enable you to track marginal or faulty ports that can
affect throughput or the switch performance.
You can run reports on the command line using a telnet session, or by using Advanced Web
Tools (if you have installed a Web Tools license). Both tools generate reports that contain the
same information, but is presented differently.
The examples in this chapter use the command line interface.
You can generate the following types of reports using Fabric Watch:
• SAM report, page 81
• Switch health report, page 82
• Switch status policy report, page 83
SAM report
The Switch Availability Monitor (SAM) report lets you see the uptime and downtime for each
port. It also enables you to check if a particular port is failing more often than the others. The
following is an example of a SAM report.