
HP StorageWorks Fabric OS 5.0.0 Fabric Watch User Guide (AA-RW1TA-TE, May 2005)
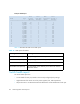
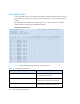
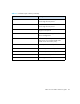
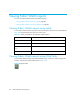

Table Of Contents
- Contents
- About this guide
- An introduction to Fabric Watch
- Fabric Watch concepts
- Fabric watch components
- Configuring events
- Port persistence
- Notification methods
- Switch policies
- Interpreting event messages
- Activating and accessing Fabric Watch
- Configuring Fabric Watch
- Configuring Fabric Watch thresholds
- Configuring notifications
- Configuring switch status policy
- Configuring FRUs
- Configuring Fabric Watch using Web Tools
- Configuring Fabric Watch using SNMP
- Generating Fabric Watch reports
- Default threshold values
- Basic Fabric Watch configuration guidelines
- Using Fabric Watch with configuration files
- Glossary
- Index

Generating Fabric Watch reports86
Viewing Fabric Watch reports
You can view Fabric Watch reports in the following ways:
• Viewing Fabric Watch reports using telnet, page 86
• Viewing Fabric Watch reports using Web Tools, page 86
Viewing Fabric Watch reports using telnet
To view Fabric Watch reports using telnet, start a telnet session and enter the command (from
Table 20) corresponding to the report you want to view.
Viewing Fabric Watch reports using Web Tools
To view Fabric Watch reports using Advanced Web Tools, connect to a switch using a web
browser, and select the report button (shown in Figure 20).
Figure 20 Report button
Table 20 Telnet commands for viewing Fabric Watch reports
Use the command To view
fwSamShow Port failure rate report
switchStatusShow Switch health report
switchStatusPolicyS
how
Switch status policy report
fwPortDetailShow Port detail report