
HP StorageWorks Fabric OS 5.0.0 Fabric Watch User Guide (AA-RW1TA-TE, May 2005)
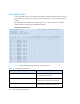
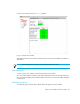
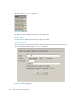

Table Of Contents
- Contents
- About this guide
- An introduction to Fabric Watch
- Fabric Watch concepts
- Fabric watch components
- Configuring events
- Port persistence
- Notification methods
- Switch policies
- Interpreting event messages
- Activating and accessing Fabric Watch
- Configuring Fabric Watch
- Configuring Fabric Watch thresholds
- Configuring notifications
- Configuring switch status policy
- Configuring FRUs
- Configuring Fabric Watch using Web Tools
- Configuring Fabric Watch using SNMP
- Generating Fabric Watch reports
- Default threshold values
- Basic Fabric Watch configuration guidelines
- Using Fabric Watch with configuration files
- Glossary
- Index
87Fabric OS 5.0.0 Fabric Watch user guide
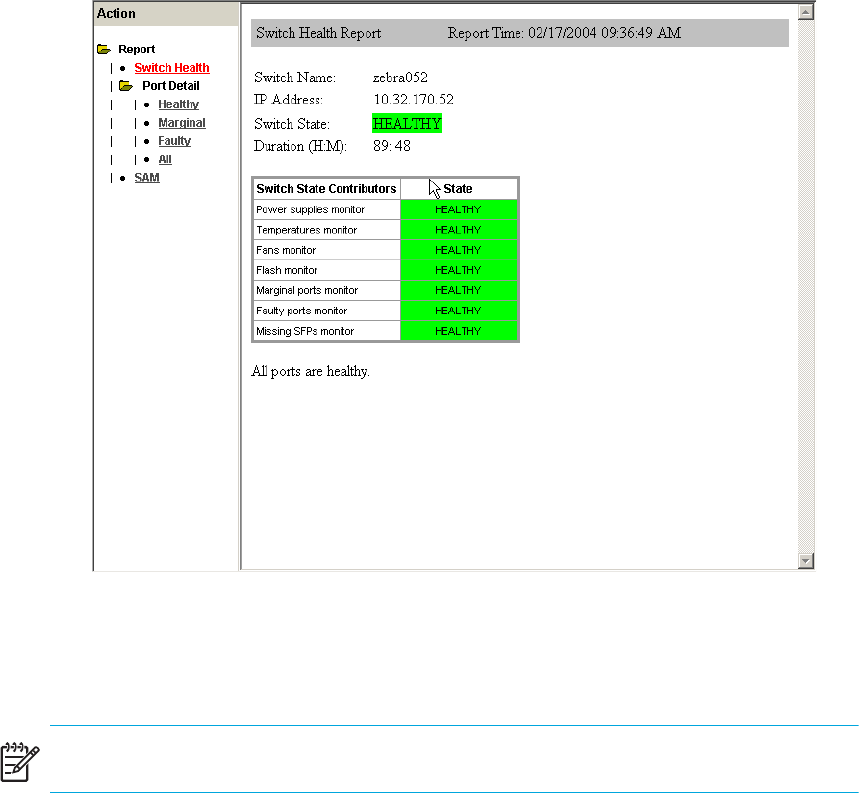
A report view window (shown in Figure 21) appears.
Figure 21 Report view window
The Web Tools report view window contains choices to view the switch health, port detail, or
SAM report.
NOTE: The switch status policy report is not available through Web Tools.
Viewing reports
To view a report, click its name on the left of the report view window.
You can use this interface to filter the port detail report based on the current state of the port.
You can choose to display the port detail report for all ports or for only the Healthy, Marginal,
or Faulty ports.
Customizing reports
To customize reports, click the Action button above the report tree in the window.