
User's Manual


I
-
I
-
Making Basic Measurements Using Spectrum Analyzer Mode
Identifying Distortion Products Using the RF Attenuator and Traces
SCALE
LOG
IIN
INT
AMP
ON
OFF
WA
VB
SC
FS
COW
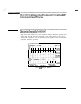
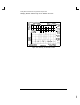
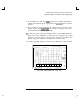
Figure 4-21. RF Attenuation of 10 dB
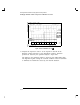
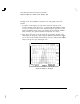
6. Compare the response in trace A to the response in trace B. If the
distortion product decreases as the attenuation increases, distortion
products are caused by the spectrum analyzer’s input mixer.
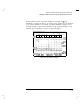
The change in the distortion product is shown by the marker-delta value.
The high-level signals causing the overload conditions must be attenuated
to eliminate the interference caused by the internal distortion.
4-32
-