
User's Manual


I
-
I
-
Making Measurements Using Spectrum Analyzer Mode
Stimulus-Response Measurements
REF
PEAK
LOG
10
dB/
OL
38
7
dB
WA-SE
SC
FC
CORf
4e
1
3
1.8
dBmV
AT
10
dB
“ID
AVG
ON
Ofi
DETECTOR
”
SP
NG
NORML
IZE
o&l
OFF
NORMLIZE
POSITION
A
<-->
B
#RES
BW
10
kHz
SPAN
500.0
MHZ
VBW
10
kHz
SWP
15.0
set
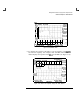
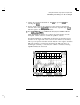
Figure 5-9. Normalized Trace
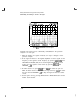
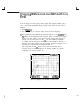
9. To measure the rejection of the filter at a given frequency, press
(MKR),
and enter the frequency. For example, enter 350 MHz. The marker
readout displays the rejection of the
Clter
at 350 MHz (see Figure 5-10).
/tp
MKR
350
0
MHZ
REF
48.8
dBmV
AT
10
d8
PEAK
LOG
10
-
-w-
dB/
-20.79
dB
MARKER
c
WA-SB
SC
FC
CORA
MARKER
AMPTO
SELECT
1234
MARKER
1
Q
OFF
CENTER
350.0
MHz
SPAN
500.0
MHz
XRES
BW
10
kHz
VBW
10
kHZ
SWP
15.0
set
Figure 5-10. Measure the Rejection Range with Delta Markers
5-21