
Memory performance on HP Z840/Z640/Z440 Workstation
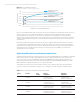


Figure 3. HP Z440 memory performance
Stream (Triad)
Lightly threaded
0.50
0.42
0.24
0.40
0.71
1.00
Relative bandwidth
1.20
1.00
0.80
0.60
0.40
0.20
0.00
4 x 4 GB DIMMs (4 ch)
all cores
4 x 4 GB DIMMs (4 ch)
1 core
2 x 4 GB DIMMs (2 ch)
all cores
2 x 4 GB DIMMs (2 ch)
1 core
2 x 8 GB DIMMs (2 ch)
all cores
2 x 8 GB DIMMs (2 ch)
1 core
1 x 8 GB DIMMs (1 ch)
all cores
1 x 8 GB DIMMs (1 ch)
1 coreHighly threaded
1.00
0.56
0.28
Figure 4. HP Z440 Product Development
Total index
AutoCAD 2014 SPECapc Solidworks SPECapc NX8.5 SPECwpc
CPU
composite
CPU
composite
Graphics
composite
Graphics
composite
WPCcfd
Relative performance
1.10
1.00
0.90
0.80
0.70
0.60
0.50
0.40
0.30
4 x 4 GB DIMMs
(16 GB - 4 ch loaded)
2 x 8 GB DIMMs
(16 GB - 2 ch loaded)
2 x 4 GB DIMMs
(8 GB - 2 ch loaded)
1 x 8 GB DIMM
(8 GB - 1 ch loaded)
Comparison 2Comparison 1
As a reference point, gure 3 shows the memory bandwidth relationship between a balanced conguration (all memory
channels loaded) and an unbalanced conguration (not all memory channels loaded), both in the lightly threaded case
and in the highly threaded case.
The results across the applications and workloads tested show some cases where the performance impact of memory
channel loading is small and other cases where the performance impact is similar to that shown in gure 3.
HP Z440 comparison results
The Comparison 1 results shown in gures 4, 5, and 6 below are for 16 GB congurations with 4 channels versus 2 channels
loaded. The Comparison 2 results are for 8 GB congurations with 2 channels versus 1 channel loaded. Results are normalized
to the 16 GB, 4 channels loaded conguration. This is done to highlight the performance impact due to channel loading.
In the below comparisons, result variation from 2-3% is considered run-to-run variation and is not considered a true
performance variation.
Technical white paper | Memory performance on HP Z840/Z640/Z440 Workstations
4