
Medical Archive Solutions User Guide


HPMA User Guide
42
HP Medical Archive
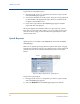
5. In the Custom Query panel, enter the Start Date and End Date for
your report. Use the format YYYY/MM/DD HH:MM:SS for both
entries.
6. Select the Custom Query button to generate and display the
report. The report appears after a few moments.
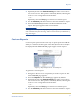
To view other time ranges, or to see a wider (zoom out) or narrow
(zoom in) range of time, modify the start and end dates in the custom
report form.
Report Formats
Chart and text reports present essentially the same data in very differ-
ent ways. You can use each report format to suit your specific
reporting needs. Chart reports give a graphical presentation of data.
Text reports give the basic data in a simple table with no customization
options after the report has been created.
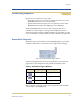
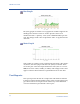
Charts
Chart reports present the data with the attribute values (vertical axis)
over a specified time span (horizontal axis). The types of chart reports
available are detailed below. If the numbers in the chart represent a
volume portion (such as the percentage of memory being used), the
area under bars is shaded. If the numbers represent exact values (such
as the number of system restarts), the bars appear as a simple line with
no shading.
CAUTION
Allow several minutes for charts to appear. Although the
Content frame may update fairly quickly, charts can take several
minutes to tabulate and form the image. Do not initiate another
report request until the current one has completed.