
Medical Archive Solutions User Guide


HPMA User Guide
44
HP Medical Archive
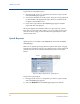
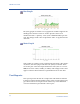
Bar Graph
Bar (area) graphs are similar to level graphs but include a light brown
shading below the line. These are used to plot the values of an
attribute that has a “quantity” value (such as Service Load, a percent-
age). The changes in the value are plotted in “bins” at regular intervals
over time.
State Graph
State graphs are similar to level graphs but the transition is discontinu-
ous; that is, the value jumps from one state (value) to another. These
are used to plot values that represent distinct states (such as a service
State, that can be online, standby, or offline). The changes in the value
appear as distinct horizontal lines at predefined levels on the chart.
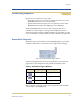
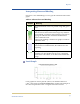
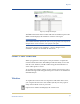
Text Reports
Text reports present the data in a simple table with the date and time
in the first column and the attribute values in the second column. They
give the basic data in a simple format without any of the additional
overview information provided in a chart report.