
Comware CLI Commands in Provision Software 2013/06


display counters rate
Related ProVisionComware
show int <int>display counters rate
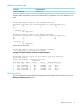
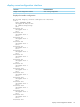
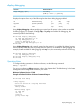
Displays traffic rate statistics over the last 300 seconds. The statistics cover only interfaces in up
state.
HP Switch# display counters rate outbound interface
Interface Total(pkts/sec) Broadcast(pkts/sec) Multicast(pkts/sec)
A1 84 0 42
A2 0 0 0
Overflow: n/a
--: not supported.
HP-5406zl# display counters rate inbound interface
Interface Total(pkts/sec) Broadcast(pkts/sec) Multicast(pkts/sec)
A1 0 0 0
A2 88 0 44
Overflow: n/a
--: not supported.
When all ports are down:
HP Switch# display counters rate outbound interface
No statistics, or no counted interface.
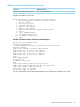
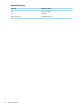
Example of Related ProVision Software Command Output.
HP Switch# show int custom 1-4 port name:4 type vlan intrusion
speed enabled mdi
Status and Counters - Custom Port Status
Intrusion
Port Name Type VLAN Alert Speed Enabled MDI-mode
---- ---- ---- ------ ------- --------- ------- ------
1 Acco 100/1000T 1 No 1000FDx Yes Auto
2 Huma 100/1000T 1 No 1000FDx Yes Auto
3 Deve 100/1000T 1 No 1000FDx Yes Auto
4 Lab1 100/1000T 1 No 1000FDx Yes Auto
Operating Notes
For more information, refer to the latest Management and Configuration Guide for your switch.
Minimum Software Version: 15.10.
display counters rate 31