
A6826A - PCI-X Dual Channel 2Gb/s Fibre Channel Adapter Performance Paper for Integrity Servers
4
4KB 8KB 4KB 8KB
of Ports
Tput
1
CPU
2
SD
3
Tput
1
CPU
2
SD
3
Tput
1
CPU
2
SD
3
Tput
1
CPU
2
SD
3
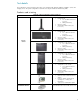
Single 135 39%
2.8
189 30%
1.5
79 26%
3.2
111 21%
1.8
Dual 272 72%
2.6
379 55%
1.4
157 45%
2.8
223 36%
1.6
NOTE:
1
Throughput in MB/s
2
Single CPU utilization numbers
3
Service Demand in microseconds calculated using ((%CPU utilization/100)/ Throughput in KB/s)(10^6)
Data gathered on an rx4640server configured with a single CPU
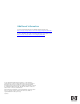
Throughput
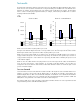
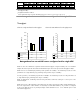
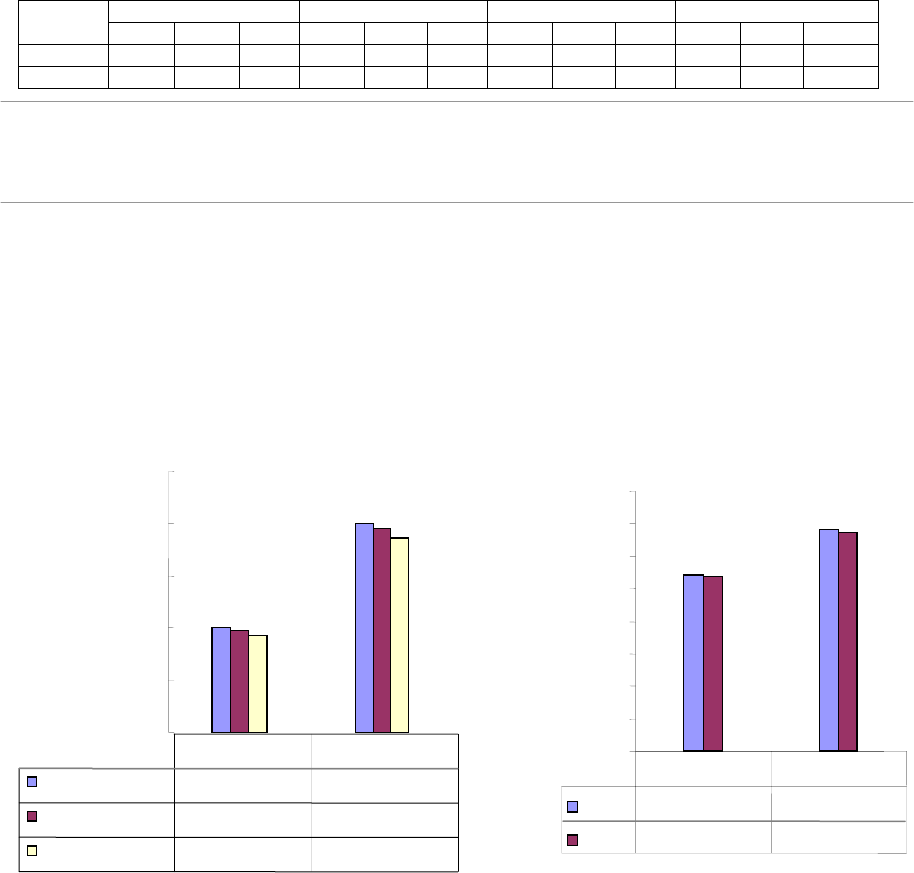
Chart 2a: Single and Dual Port Throughput Chart 2b: CPU Utilization for Throughput Tests
Data
gathered on an rx4640 server configured with a single CPU
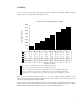
Chart 2a shows the 128KB raw sequential read and write throughput of single and dual ports on an A6826A
adapter. The X-axis represents the number of Fibre Channel ports. The Y-axis represents the throughput in MB/s.
Chart 2a shows one A6828A port performing read operations at 195MB/s. Two A6826A ports scale to 2x the
performance of a single A6826A port, performing read operations at up to 390MB/s.
For write operations, one A6826A port performs at 186MB/s. Two A6826A ports scale to 2x the performance of
a single A6826A port, performing writes at up to 372MB/s.
Chart 2a demonstrates outstanding read and write performance with linear scaling for 1 and 2 ports on the
A6826A adapter.
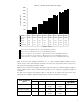
Chart 2b shows the % CPU utilization in throughput tests. The X-axis represents the number of Fibre Channel ports.
The Y-axis represents the % CPU utilization. To accurately record the CPU utilization, only one CPU is configured
in these tests. Chart 2b shows very small percentages of CPU utilization for one or two A6826A ports in read
and write throughput tests.
0
100
200
300
400
500
Throu
g
hput (MB/s)
Theoretical Max.
200 400
Read
195 390
W
rite
186 372
1 Port 2 Ports
0
2
4
6
8
10
12
14
16
% CPU Utilization
Read
10.9 13.7
Write
10.8 13.5
1 Port 2 Ports