
HP 3PAR Management Console 4.5.1 Software User Guide
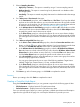


3. Select a Sampling Resolution:
• High (Every 5 minutes) – The report is created by using a 5–minute sampling interval.
• Medium (Hourly) – The report is created using hourly data stored in a database within
the storage system.
• Low (Daily) – The report is created using daily data stored in a database within the storage
system.
4. For a Values over a Time Interval chart type:
a. In the Time Interval group box, select a Start Time and End Time. If you keep the default
end time as the current date and time, you can select the start time to be a specific number
of hours prior to the end time. You also have the option to select a specific date and time
for both the start and end times, see “Time Interval Group Box” (page 444).
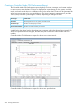
b. In the Indicate values for the following: group box, select the All radio button to include
values for all QoS rules or select the Filter radio button, then click the Select Objects button
to specify the specific virtual volume sets to include.
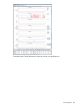
c. In the Show Charts group box, select the checkboxes for one or more charts to display:
IOPs, Bandwidth, Service Time, Wait Time, I/O Size, Reject, and Queue Length. At least
one chart type must be selected. The default chart types are IOPs, Bandwidth, and Service
Time.
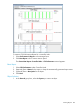
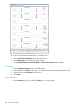
5. For a Values at a Specified Time chart type:
a. In the Point in Time or Date and Time group box, select the Current date and time radio
button, or click the icon to select a date and time. If you have selected a specific date
and time, the Selected date and time radio button is automatically selected.
b. In the Indicate values for the following: group box, select the All within Virtual Volume
Sets radio button to include values for all QoS rules, select the All Others without Virtual
Volume Sets for values without an active QoS rule, or select the Filter radio button, then
click the Select Objects button to specify the specific virtual volume sets to include.
c. In the Group Values group box, select the attributes you want to use to group chart values.
At least one group type must be selected.
You can group chart reports by one or more of the following attributes: Target Name
(default), Target Type, Domain Name, I/O Limit, and Bandwidth Limit.
d. In the Show Charts group box, select the checkboxes for one or more charts to display:
IOPs, Bandwidth, Service Time, Wait Time, I/O Size, Reject, and Queue Length. At least
one chart type must be selected. The default chart types are IOPs, Bandwidth, and Service
Time.
6. Click Next to go to the Summary page, or click Finish to complete the wizard.
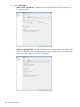
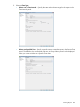
Summary
Review your settings, then click Finish to complete the wizard.
Creating a Controller Node Report
Using the Create New Report wizard, you can generate a report for the following types of data:
• CPU Performance – Displays historical CPU performance data.
• Cache Performance – Displays historical node performance data.
Once you select the type of report you want to generate, a default report Name and Description
appears to the right side of the page. You can keep the default text or provide your own.
Creating Reports 421