
MSM7xx Controllers Configuration Guide v6.4.0
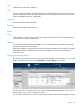
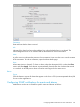
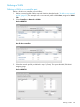
The Severity, Device, Alarm, and Timestamp columns display detailed information if you hover the
mouse pointer over an entry in the table as shown.
You can also sort events in any column (except Description) by clicking the column title.
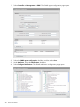
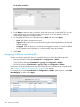
Filter events by
To see only a subset of all events, select a filter condition and click Apply. Filters are saved across
sessions and can be cleared by selecting Clear filters. To see only a subset of all events, select a
filter condition and click Apply.
Filters are saved across sessions and can be cleared by selecting Clear filters.
Table
Severity
• Critical (Red): Events of this type indicate a failure and signal the need for immediate attention.
• Major (Orange): Events of this type indicate an impending failure.
• Minor (Yellow): Events of this type indicate a warning condition that can escalate into a more
serious problem.
• Informational (Green): Events of this type require no action. They are provided for information
purposes.
ID
Unique number assigned to the event.
Device
Indicates the device that detected the event. Hover the mouse pointer over the device name to see
the device type and its MAC address.
Category
Events are classified into categories so that they can be sorted. Categories include:
• 802.1X
• Controlled AP
• DHCP
• IDS
• MAC Authentication
• Maintenance
• MTM
• Public Access
• REI
• RRM
• Teamed Controller
• Teaming
• Wireless
• WPA
• VPN
• VSC
212 Events and alarms