
MSM7xx Controllers Configuration Guide v6.4.0

3 Dashboard
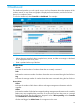
The dashboard provides you with a quick way to view key information about the operation of the
wireless network. It uses charts and graphs to display status and statistics, and shows 24-hour
history for a number of items.
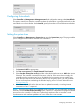
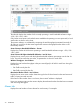
To view the dashboard, select Controller >> Dashboard. For example:
NOTE:
• Unless otherwise specified, data is sampled every minute, and then an average is calculated
to be displayed as the hourly value.
• Data is updated at the top of the hour.
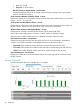
Wireless clients
Current
Indicates the total number of wireless clients that are currently connected.
Peak
Indicates the maximum number of wireless clients that were connected during the last 24 hours.
Avg
Indicates the average number of wireless clients that were connected during the last 24 hours.
Access Points
Online
Indicates the number of APs that are able to exchange management information with the
controller.
Offline
Indicates the number of APs that have stopped sending management information to the controller.
Rediscovery may re-establish the connection. If not, the APs may have lost power or a network
failure has occurred. The APs will have a diagnostic value of Not responding on the Controller
>> Controlled APs > Discovered APs page.
APs that are flagged as Admin Down do not appear in this count.
25