
MSM7xx Controllers Configuration Guide v6.4.0
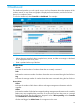

The tab title displays the number of APs currently operating in each bandwidth utilization range:
<50%, 50% - 80%, >80%.
Only online access points with radios that are enabled and operating in access point and/or local
mesh mode are shown on this chart.
The percent utilization is calculated by comparing the total throughput (transmitted/received) of
all radios on an AP for the last minute against the maximum throughput that the radios could
theoretically achieve.
Access Points per Bandwidth Utilization - Current
Displays the number of APs that are operating in each bandwidth utilization range: <50%, 50%
- 80%, >80%.
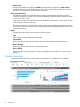
Access Points with Highest Bandwidth Utilization - Last 24 Hours
Displays the ten access points with the highest bandwidth utilization percentage over the last 24
hours. If an AP has more than one radio, a separate bar is shown for each radio.
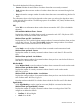
Wireless Throughput - Last 24 Hours
Displays the total wireless throughput in bits per second (bps) for all APs for each hour during the
last 24 hours.
• Tx: Traffic sent by the APs.
• Rx: Traffic received by the APs.
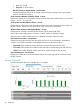
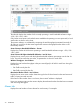
Most Active Wireless Clients - Last 24 Hours
Displays the ten most active wireless clients during the last 24 hours based on the total amount of
traffic (in bytes) sent and received.
If the name of the wireless client is not known, then its MAC address is displayed.
Hover your mouse pointer over the name to display the total time that the client has been connected
and its average throughput.
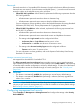
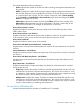
Alarms tab
Displays the total number of active alarms for each severity. For example:
30 Dashboard