
hp 49g+_user's guide_English_E_DCVL5300427_V2


Page 12-30
You can have more than one condition plotted at the same time if you multiply
the conditions. For example, to plot the graph of the points for which X
2
/36
+ Y
2
/9 < 1, and X
2
/16 + Y
2
/9 > 1, use the following:
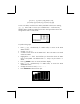
• Press „ô, simultaneously if in RPN mode, to access to the PLOT
SETUP window.
• Press ˜ and type ‘(X^2/36+Y^2/9 < 1)⋅ (X^2/16+Y^2/9 > 1)’@@@OK@@@
to define the conditions to be plotted.
• Press @ERASE @DRAW to draw the truth plot. Again, you have to be patient
while the calculator produces the graph. If you want to interrupt the plot,
press $ , once. Then press @CANCEL .
Plotting histograms, bar plots, and scatter plots
Histograms, bar plots and scatter plots are used to plot discrete data stored in
the reserved variable ΣDAT. This variable is used not only for these types of
plots, but also for all kind of statistical applications as will be shown in
Chapter 18. As a matter of fact, the use of histogram plots is postponed until
we get to that chapter, for the plotting of a histogram requires to perform a
grouping of data and a frequency analysis before the actual plot. In this
section we will show how to load data in the variable ΣDAT and how to plot
bar plots and scatter plots.
We will use the following data for plotting bar plots and scatter plots:
x y z
3.1 2.1 1.1
3.6 3.2 2.2
4.2 4.5 3.3
4.5 5.6 4.4
4.9 3.8 5.5
5.2 2.2 6.6
Bar plots
First, make sure your calculator’s CAS is in Exact mode. Next, enter the
data shown above as a matrix, i.e.,