
hp 49g+_user's guide_English_E_DCVL5300427_V2


Page 12-31
[[3.1,2.1,1.1],[3.6,3.2,2.2],[4.2,4.5,3.3],
[4.5,5.6,4.4],[4.9,3.8,5.5],[5.2,2.2,6.6]] `
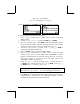
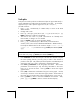
to store it in ΣDAT, use the function STOΣ (available in the function catalog,
‚N). Press VAR to recover your variables menu. A soft menu key
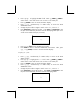
labeled ΣDAT should be available in the stack. The figure below shows the
storage of this matrix in ALG mode:
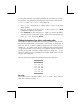
To produce the graph:
• Press „ô, simultaneously if in RPN mode, to access to the PLOT
SETUP window.
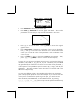
• Change
TYPE to Bar.
• A matrix will be shown at the ΣDAT field. This is the matrix we stored
earlier into ΣDAT.
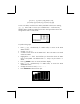
• Highlight the
Col: field. This field lets you choose the column of ΣDAT
that is to be plotted. The default value is 1. Keep it to plot column 1 in
ΣDAT.
• Press L@@@OK@@@ to return to normal calculator display.
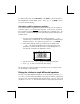
• Press „ò, simultaneously if in RPN mode, to access the PLOT
WINDOW screen.
• Change the V-View to read,
V-View: 0 5.
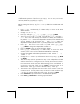
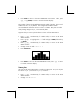
• Press @ERASE @DRAW to draw the bar plot.