
Advanced Traffic Management Guide K/KA/KB.15.15
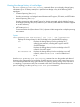
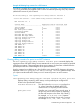


Example 86 Viewing show spanning-tree root-history MSTI output
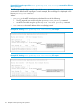
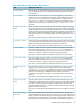
Enabling traps and Viewing trap configuration
Syntax
[no] spanning-tree trap { errant-bpdu | loop-guard | new-root |
root-guard }
Enables or disables SNMP traps.
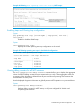
Syntax
show spanning-tree traps
Displays the current spanning tree trap configuration on the switch.
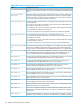
Example 87 Viewing spanning tree traps in their default configuration
HP Switch#: show spanning-tree traps
Status and Counters - STP Traps Information
Trap Name | Status
---------------------- + --------
errant-bpdu | Disabled
new-root | Disabled
root-guard | Disabled
loop-guard | Disabled
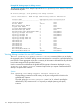
Viewing debug counters for all MST instances
The show spanning-tree debug-counters command allows you to display the aggregate
values of all MSTP debug counters that are maintained on a switch. These aggregate values are
a summary of the information collected from all ports and from all spanning tree instances that
forward traffic on switch ports.
Use the displayed diagnostic information to globally monitor MSTP operation on a per-switch basis.
Syntax:
show spanning-tree debug-counters
Displays debug counters for MSTP activity on all ports configured for VLANs used
in spanning tree instances.
Troubleshooting an MSTP configuration 113