
Advanced Traffic Management Guide K/KA/KB.15.15
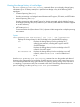
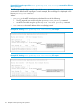
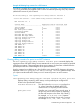


Example 88 Viewing output for debug counters
The following example shows sample output of the show spanning-tree debug-counters
command for all ports.
HP Switch(config)#: show spanning-tree debug-counters
Status and Counters - MSTP Bridge Common Debug Counters Information
Counter Name Aggregated Value Collected From
--------------------------------- ---------------- --------------
Invalid BPDUs 0 CIST
Errant BPDUs 170927 CIST
MST Config Error BPDUs 0 CIST
Looped-back BPDUs 0 CIST
Starved BPDUs/MSTI MSGs 0 CIST/MSTIs
Exceeded Max Age BPDUs 0 CIST
Exceeded Max Hops BPDUs/MSTI MSGs 0 CIST/MSTIs
Topology Changes Detected 2 CIST/MSTIs
Topology Changes Tx 6 CIST/MSTIs
Topology Changes Rx 4 CIST/MSTIs
Topology Change ACKs Tx 0 CIST
Topology Change ACKs Rx 0 CIST
TCN BPDUs Tx 0 CIST
TCN BPDUs Rx 0 CIST
CFG BPDUs Tx 0 CIST
CFG BPDUs Rx 0 CIST
RST BPDUs Tx 0 CIST
RST BPDUs Rx 0 CIST
MST BPDUs/MSTI MSGs Tx 10 CIST/MSTIs
MST BPDUs/MSTI MSGs Rx 341802 CIST/MSTIs
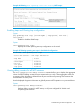
Viewing debug counters for one MST instance
The show spanning-tree debug-counters instance command allows you to display
the aggregate values of all MSTP debug counters maintained on a switch for a specified spanning
tree instance. These aggregate values are a summary of information collected from all ports that
have VLANs assigned to the specified instance.
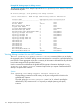
Use this command to troubleshoot the global MSTP diagnostic information displayed in show
spanning-tree debug-counters command output when you suspect unauthorized MSTP
activity in a specific MST instance.
Syntax:
show spanning-tree debug-counters instance instance-id
Displays debug counters for MSTP activity on all ports configured for VLANs in the
specified MST instance.
The valid values for instance instance-id are 0 to 16, where 0 specifies the
default MST (CIST) instance and 1 to 16 specify a multiple spanning tree (MST)
instance.
114 Multiple instance spanning tree operation