
Advanced Traffic Management Guide K/KA/KB.15.15
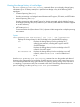


Example 90 Viewing debug counters for a CIST and MST instance
The following example shows sample output of the show spanning-tree debug-counters
instance ports command for both the CIST (default MST instance 0) and an MST instance
(instance 2) on port A15.
HP Switch(config)#: show spanning-tree debug-counters instance 0 ports a15
Status and Counters - CIST Port(s) Debug Counters Information
MST Instance ID : 0
Port : A15
Counter Name Value Last Updated
--------------------------- ---------- -----------------
Invalid BPDUs 0
Errant BPDUs 0
MST Config Error BPDUs 0
Looped-back BPDUs 0
Starved BPDUs 0
Exceeded Max Age BPDUs 0
Exceeded Max Hops BPDUs 0
Topology Changes Detected 1 02/09/07 17:40:59
Topology Changes Tx 3 02/09/07 17:41:03
Topology Changes Rx 2 02/09/07 17:41:01
Topology Change ACKs Tx 0
Topology Change ACKs Rx 0
TCN BPDUs Tx 0
TCN BPDUs Rx 0
CFG BPDUs Tx 0
CFG BPDUs Rx 0
RST BPDUs Tx 0
RST BPDUs Rx 0
MST BPDUs Tx 5 02/09/07 17:41:03
MST BPDUs Rx 173540 02/13/07 18:05:34
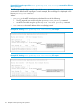
Example 91 Viewing debug counters output for one port in an MST instance
The following example shows spanning tree debug-counters instance ports command output for
one port in an MST instance.
HP Switch(config)#: show spanning-tree debug-counters instance 2 ports a15
Status and Counters - MSTI Port(s) Debug Counters Information
MST Instance ID : 2
Port : A15
Counter Name Value Last Updated
--------------------------- ---------- -----------------
Starved MSTI MSGs 0
Exceeded Max Hops MSTI MSGs 0
Topology Changes Detected 1 02/09/07 17:40:59
Topology Changes Tx 3 02/09/07 17:41:03
Topology Changes Rx 2 02/09/07 17:41:01
MSTI MSGs Tx 5 02/09/07 17:41:03
MSTI MSGs Rx 173489 02/13/07 18:03:52
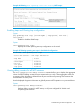
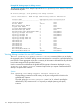
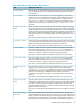
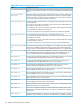
Field descriptions in MSTP debug command output
The following table contains descriptions of the debugging information displayed in the output of
show spanning-tree debug-counters commands.
116 Multiple instance spanning tree operation