
Understanding endurance and performance characteristics of HP solid state drives

8
We execute 100% sequential write tests at 256 KB request size, which writes the entire capacity of
the SSD at least twice. For a 200 GB drive with a throughput of 100 MB/s, we run two 33-minute
test passes. As a result, the SSD is fully written and properly conditioned.
We run several hours of 100% random writes tests at 8 KB request size and 4 KBKB aligned. We
continue to run the tests until the IOPS performance drops and then stabilizes.
This procedure ensures that an HP SSD has reached a steady state in terms of its operational overhead.
It also ensures that performance test results after the pre-conditioning reflect SSD performance in a real
world application environment.
SSD Latency
With any data storage device, latency is the time it takes to execute a read or a write command. In
benchmarks and in real life, we measure latency as the average latency over a given period while
executing a predetermined profile of read commands, write commands, or both. Naturally, average
latency varies depending on the size (4 KB vs. 256 KB) and type (random vs. sequential) of commands
executed. Latency also varies depending on the mixture of read versus write commands in the
workload.
Origins of SSD latency
At first, you may be slightly surprised to see a discussion of SSD latency. After all, with traditional disk
drives the head seek time and the rotational latency of the disk drives are the primary contributors to
overall latency. SSDs have no rotational latency, but they do have latency. It is simply from different
sources than for disk drives.
With SSDs, latency comes primarily from the processing overhead associated with managing and
executing individual NAND operations. These operations are required to fulfill the higher-level host
read or write. This includes any or all of the following:
Managing the contention for the limited number of channels between the NAND controller and the
NAND flash
Translating host logical addresses into physical NAND memory addresses
Executing the individual NAND reads or writes needed to complete a command
For writes, erasing NAND blocks before a write can be completed
Executing general NAND background management activity, including the NAND block management
associated with wear-leveling
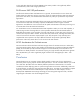
SSD writes tend to incur a greater overhead than reads. That’s because writes tend to generate NAND
block management activity in the SSD controller, where simple reads do not. As a result, SSD
performance in standardized benchmarks such as Iometer tests will tend to decrease as the percentage
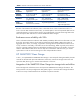
of writes in the test increases. As Table 3 illustrates, average SSD latency remains significantly lower
than that of HDDs.
Table 3: Typical average latencies for SSDs versus HDDs
Iometer benchmark
(70%/30% read/write, Queue=16)
Typical Average Latency
Enterprise Mainstream SSD
Typical Average Latency
SAS HDD
8 KB Random
.55 ms
3.0 ms