
F3215-HP Load Balancing Module System Management Command Reference-6PW101


67
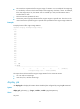
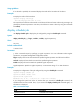
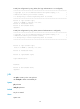
• The vertical axis represents the flow engine usage. If a statistic is not a multiple of the usage step,
it is rounded up or down to the closest multiple of the usage step, whichever is closer. For example,
if the CPU usage step is 5%, the statistic 53% is rounded up to 55%, and the statistic 52% is
rounded down to 50%.
• The horizontal axis represents the time.
• Consecutive pound signs (#) indicate the flow engine usage at a specific time. The value on the
vertical axis for the topmost # sign at a specific time represents the flow engine usage at that time.
Examples
# Display historical flow engine usage statistics.
<Sysname> display flowengine-usage history
100%|
95%|
90%|
85%|
80%|
75%|
70%|
65%|
60%|
55%|
50%|
45%|
40%|
35%|
30%|
25%|
20%|
15%|
10%| ###
5%|#####
------------------------------------------------------------
0 10 20 30 40 50 60 (minutes)
flowengine-usage last 60 minutes(SYSTEM)
The output shows the historical flow engine usage statistics for the recent 60 minutes:
• 5%: one and two minutes ago
• 10%: three, four, and five minutes ago
display job
Use display job to display information about scheduled jobs configured by using the job command.
Syntax
display job [ job-name ] [ | { begin | exclude | include } regular-expression ]
Views
Any view