
R3204P16-HP Load Balancing Module System Maintenance Configuration Guide-6PW101

6
the debugging function that was used, or use the undo debugging all command to disable all the
debugging functions.
Output of debugging information depends on the configurations of the information center and the
debugging commands of each protocol and functional module. Debugging information is commonly
output to a terminal (including console or VTY) for display. You can also output debugging information
to other destinations. For more information, see the chapter “Information center configuration.” By default,
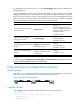
you can output debugging information to a terminal by following these steps:
To do… Use the command…
Remarks
Enable the terminal monitoring of
system information
terminal monitor
Optional
The terminal monitoring on the
console is enabled by default and
that on the monitoring terminal is
disabled by default.
Available in user view
Enable the terminal display of
debugging information
terminal debugging
Required
Disabled by default
Available in user view
Enable debugging for a specified
module
debugging { all [ timeout time ] |
module-name [ option ] }
Required
Disabled by default
Available in user view
Display the enabled debugging
functions
display debugging [ interface
interface-type interface-number ]
[ module-name ]
Optional
Available in any view
NOTE:
You must configure the debugging, terminal debugging and terminal monitor commands before you can
display the detailed debugging information on the terminal.
Ping and tracert configuration example
Network requirements
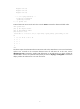
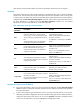
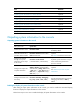
As shown in Figure 4, LB failed to telnet Device B. Determine whether LB and Device B can reach each
other. If they cannot reach each other, locate the failed nodes in the network.
Figure 4 Ping and tracert network diagram
Configuration procedure
# Use the ping command to display whether LB and Device B can reach each other.
<LB> ping 1.1.2.2
PING 1.1.2.2: 56 data bytes, press CTRL_C to break
Request time out
Request time out