
R3204P16-HP Load Balancing Module System Management Command Reference-6PW101
53
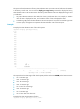
The system collects the statistics of history CPU utilization rates at a certain interval and saves the statistics
in the history record area. You can use the display cpu-usage history command to display the history
CPU utilization rates in the last 60 minutes. The history CPU utilization rates are displayed through x and
y coordinates.
• Any CPU utilization statistics value takes the closest y-coordinate value. For example, a statistics
value of 53% is displayed as 55%, and a statistics value of 52% is displayed as 50%.
• A number sign (#) shows the CPU utilization rate at a time point. If more than one number sign exists
at a time point, the highest one represents the CPU utilization rate of the time point.
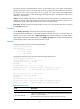
Examples
# Display the CPU utilization rates of the whole system.
<Sysname> display cpu-usage history
100%|
95%|
90%|
85%|
80%|
75%|
70%|
65%|
60%|
55%|
50%|
45%|
40%|
35%|
30%|
25%|
20%|
15%| #
10%| ### #
5%| ########
------------------------------------------------------------
10 20 30 40 50 60 (minutes)
cpu-usage last 60 minutes(SYSTEM)
The output shows the CPU usage of the whole system (with the task name SYSTEM) in the last 60 minutes:
• 5%: 12 minutes ago
• 10%: 13 minutes ago
• 15 % : 14 m i n u t e s a g o
• 10%: 15 minutes ago
• 5%: 16 and 17 minutes ago
• 10%: 18 minutes ago
• 5%: 19 minutes ago
• 2% or lower than 2%: other time
# Display the CPU usage statistics of task 6.
<Sysname> display cpu-usage history task 6