
Oracle/HP Best Practices Guide for HP IO Accelerators
Discovering your application I/O profile and selecting an architecture 14
5.
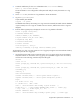
Specify a beginning and ending snapshot ID for the workload repository report. For example, enter
150 for begin_snap and 160 for end_snap.
6. Enter a report name, or accept the default report name. For example, enter awrrpt_1_150_160
(the default) for report_name. If a text report had been specified, the awrrpt_1_150_160.txt
report name is generated.
Simple analysis of an AWR report
Even if I/O bottlenecks are not found on your system, you can still improve performance by improving
I/O time.
The AWR report is divided into two sections.
Section one consists of the following items:
• A description of the Oracle database configuration
• The range of snapshots being reported
• A summary of the major statistics for the reporting period: Load Profile, Instance Efficiency
Percentages, Shared Pool Statistics, Host CPU, Instance CPU, and Memory Statistics
Section two consists of the Main Report, which includes:
• Wait Event Statistics
• SQL Statistics, Instance
• Activity Statistics
• IO Stats
• Buffer Pool Statistics
• Advisory Statistics
• Wait Statistics
• Undo Statistics
• Latch Statistics
• Segment Statistics
• Dictionary Cache Statistics
• Library Cache Statistics
• Memory Statistics
• Streams Statistics
• Resource Limit Statistics
• Shared Server Statistics
• Initialization Parameters
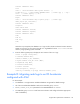
For example, to determine if db file sequential read is a top wait event, navigate to the
Foreground Wait Events subsection of the Wait Events Statistics section. The corresponding SQL code
responsible for the wait can be identified in the SQL Ordered by User I/O Wait Time subsection of the
SQL Statistics section.