
Oracle/HP Best Practices Guide for HP IO Accelerators

Discovering your application I/O profile and selecting an architecture 15
When the top waits events in the AWR report are db file sequential read or db file
scattered read, this is an indication of I/O waits. What is also important with these wait events is
how long they are taking, on average. A sequential I/O (db file sequential read) takes 1-5
milliseconds. A random read (db file scattered read) takes up to 10-15 milliseconds. However,
even the typical access times can be greatly improved by using IO Accelerators, which also greatly
reduces latency if db file scattered read conditions are encountered.
Another factor with these wait events is the total read time. When analyzing the AWR report, you might
observe some queries that perform millions of reads. For example, if a query is doing 10,000,000
sequential reads at 2 milliseconds each, this equates to 10,000 seconds or 2.7 hours of reading time.
By using flash cache or hosting database data on IO Accelerators to reduce read time to less to 1
millisecond, you can save database access time. Even if an I/O bottleneck does not occur, you can
improve performance by improving I/O time.
For more information on using IO Accelerators and flash cache with Oracle databases, see "Single-
instance performance architectures (on page 16)."
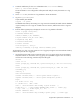
Running an ADDM report
To analyze the database file sequential read wait event, an ADDM report can be generated. An ADDM
analysis can be performed on a pair of AWR snapshots and a set of instances from the same database.
The pair of AWR snapshots defines the time period for analysis, and the set of instances define the target
for analysis.
ADDM analysis is performed top-down, first identifying symptoms, and then refining them to reach the
root causes of performance problems. The goal of the analysis is to reduce a single throughput metric
called database time. Database time is the cumulative time spent by the database in processing user
requests. It includes wait time and CPU time of all non-idle user sessions. By reducing database time, the
database is able to support more user requests using the same resources, which increases throughput. The
problems reported by ADDM are sorted by the amount of database time they are responsible for. System
areas that are not responsible for a significant portion of database time are reported as non-problem
areas.
ADDM considers the following types of problems:
• CPU bottlenecks
• Undersized memory structures
• I/O capacity issues
• High-load SQL statements
• High-load PL/SQL execution and compilation
• RAC-specific issues
• Database configuration issues
• Concurrency issues
• Hot objects and top SQL for various problem areas
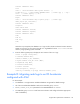
In addition to problem diagnostics, ADDM recommends possible solutions. ADDM analysis results are
represented as a set of findings. The scripts to generate this report are found in the
$ORACLE_HOME/rdbms/admin directory and are named addmrpt.sql and addmrpti.sql. AWR
and ADDM are part of the Automatic Database Diagnostic Monitoring features that were introduced in
Oracle Database 10g.