HP Unified Wired-WLAN Products Network Management and Monitoring Configuration Guide HP 830 Unified Wired-WLAN PoE+ Switch Series HP 850 Unified Wired-WLAN Appliance HP 870 Unified Wired-WLAN Appliance HP 11900/10500/7500 20G Unified Wired-WLAN Module Part number: 5998-4794 Software version: 3507P22 (HP 830 PoE+ Switch Series) 2607P22 (HP 850 Appliance) 2607P22 (HP 870 Appliance) 2507P22 (HP 11900/10500/7500 20G Module) Document version: 6W101-20140418
Legal and notice information © Copyright 2014 Hewlett-Packard Development Company, L.P. No part of this documentation may be reproduced or transmitted in any form or by any means without prior written consent of Hewlett-Packard Development Company, L.P. The information contained herein is subject to change without notice.
Contents Using ping, tracert, and system debugging ··············································································································· 1 Ping ····················································································································································································· 1 Using a ping command to test network connectivity ···························································································· 1 Ping example
NTP advantages ···················································································································································· 42 How NTP works ····················································································································································· 42 NTP message format ············································································································································· 43 NTP operation
Setting the sampling interval and statistics interval for certain MIB nodes ······························································ 81 Configuring the SNMP proxy agent for an SNMP agent ·························································································· 82 Displaying and maintaining SNMP ····························································································································· 82 SNMP configuration examples ····································
Flow logging configuration examples························································································································ 120 Troubleshooting flow logging ····································································································································· 121 Configuring sFlow ··················································································································································· 123 sFlow configur
Using ping, tracert, and system debugging Use the ping, tracert, and system debugging utilities to test network connectivity and identify network problems. Ping The ping utility sends ICMP echo requests (ECHO-REQUEST) to the destination device. Upon receiving the requests, the destination device responds with ICMP echo replies (ECHO-REPLY) to the source device.
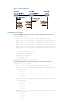
Figure 1 Network diagram Configuration procedure # Use the ping command on Device A to test connectivity to Device C. ping 1.1.2.2 PING 1.1.2.2: 56 data bytes, press CTRL_C to break Reply from 1.1.2.2: bytes=56 Sequence=1 ttl=254 time=205 ms Reply from 1.1.2.2: bytes=56 Sequence=2 ttl=254 time=1 ms Reply from 1.1.2.2: bytes=56 Sequence=3 ttl=254 time=1 ms Reply from 1.1.2.2: bytes=56 Sequence=4 ttl=254 time=1 ms Reply from 1.1.2.2: bytes=56 Sequence=5 ttl=254 time=1 ms --- 1.1.2.
1.1.1.1 Reply from 1.1.2.2: bytes=56 Sequence=4 ttl=254 time=1 ms Record Route: 1.1.2.1 1.1.2.2 1.1.1.2 1.1.1.1 Reply from 1.1.2.2: bytes=56 Sequence=5 ttl=254 time=1 ms Record Route: 1.1.2.1 1.1.2.2 1.1.1.2 1.1.1.1 --- 1.1.2.2 ping statistics --5 packet(s) transmitted 5 packet(s) received 0.00% packet loss round-trip min/avg/max = 1/11/53 ms The test procedure with the ping –r command (see Figure 1) is as follows: 1.
Figure 2 Traceroute operation Tracert uses received ICMP error messages to get the IP addresses of devices. As shown in Figure 2, tracert works as follows: 1. The source device (Device A) sends a UDP packet with a TTL value of 1 to the destination device (Device D). The destination UDP port is not used by any application on the destination device. 2.
hoplimit-expires enable command on the devices. For more information about this command, see Layer 3 Command Reference. • Enable sending of ICMPv6 destination unreachable packets on the destination device. If the destination device is an HP device, execute the ipv6 unreachables enable command. For more information about this command, see Layer 3 Command Reference. Using a tracert command to identify failed or all nodes in a path Execute tracert commands in any view.
Figure 3 Relationship between the protocol and screen output switch Debugging a feature module Output from debugging commands is memory intensive. To guarantee system performance, enable debugging only for modules that are in an exceptional condition. When debugging is complete, use the undo debugging all command to disable all the debugging functions. Configure the debugging, terminal debugging and terminal monitor commands before you can display detailed debugging information on the terminal.
Step 4. Command display debugging [ interface interface-type interface-number ] [ module-name ] [ | { begin | exclude | include } regular-expression ] Display the enabled debugging functions. Remarks Optional. Available in any view. Ping and tracert example Network requirements As shown in Figure 4, AC failed to Telnet Device B. Determine whether AC and Device B can reach each other. If they cannot reach each other, locate the failed nodes in the network.
3 * * * 4 * * * 5 The output shows that AC and Device B cannot reach each other, AC and Device A can reach each other, and an error occurred on the connection between Device A and Device B. # Use the debugging ip icmp command on AC and Device B to verify that they can send and receive the specific ICMP packets, or use the display ip routing-table command to verify the availability of active routes between AC and Device B.
Configuring NQA Overview Network quality analyzer (NQA) allows you to monitor link status, measure network performance, verify the service levels for IP services and applications, and troubleshoot network problems.
• A UDP echo operation sends a UDP packet. • An SNMP operation sends one SNMPv1 packet, one SNMPv2c packet, and one SNMPv3 packet. Collaboration NQA can collaborate with the Track module to notify application modules of state or performance changes, so that the application modules can take predefined actions. Figure 6 Collaboration The following describes how a static route destined for 192.168.0.88 is monitored through collaboration: 1. NQA monitors the reachability to 192.168.0.88. 2. When 192.
NQA configuration task list Complete the following task to configure the NQA server: Task Remarks Configuring the NQA server Required for NQA operations types of TCP, UDP echo, and UDP jitter. Complete these tasks to configure the NQA client: Task Remarks Enabling the NQA client Required. Configuring an ICMP echo operation Configuring a DHCP operation Configuring an FTP operation Configuring an HTTP operation Required. Configuring a UDP jitter operation Use at least one method.
Step 2. Enable the NQA server. Command Remarks nqa server enable Disabled by default. • Method 1: 3. Configure a listening service. nqa server tcp-connect ip-address port-number • Method 2: Use at least one method. nqa server udp-echo ip-address port-number Configuring the NQA client Enabling the NQA client Step Command Remarks N/A 1. Enter system view. system-view 2. Enable the NQA client. nqa agent enable Optional. Enabled by default.
Step 6. Command Configure the string to be filled in the payload of each ICMP echo request. Remarks Optional. data-fill string By default, the string is the hexadecimal number 00010203040506070809. Optional. • Method 1: 7. Specify the source interface or the source IP address of ICMP echo requests. source interface interface-type interface-number • Method 2: source ip ip-address By default, no source interface or source IP address is configured.
Configuring an FTP operation An FTP operation measures the time it takes for the NQA client to transfer a file to or download a file from an FTP server. Follow these guidelines when you configure an FTP operation: • Before you perform an FTP operation, obtain the username and password for logging in to the FTP server. • When you execute the put command, the NQA client creates a file named file-name of fixed size on the FTP server.
Step Command 10. Set the data transmission mode. mode { active | passive } Remarks Optional. active by default. Configuring an HTTP operation An HTTP operation measures the time it takes for the NQA client to obtain data from an HTTP server. The TCP port number of the HTTP server must be 80. Otherwise, the HTTP operation fails. To configure an HTTP operation: Step Command Remarks 1. Enter system view. system-view N/A 2. Create an NQA operation and enter NQA operation view.
Jitter means inter-packet delay variance. A UDP jitter operation measures unidirectional and bidirectional jitters so that you can verify whether the network can carry jitter-sensitive services such as real-time voice and video services. The UDP jitter operation works as follows: 1. The NQA client sends UDP packets to the destination port at a regular interval. 2. The destination device takes a time stamp to each packet that it receives, and then sends the packet back to the NQA client. 3.
Step Command Remarks 11. Configure how long the NQA client waits for a response from the server before it regards the response times out. probe packet-timeout packet-timeout Optional. 3000 milliseconds by default. Optional. 12. Configure the source IP address for UDP packets. By default, no source IP address is specified. source ip ip-address The source IP address must be the IP address of a local interface. The local interface must be up. Otherwise, no UDP packets can be sent out.
Configuring a TCP operation A TCP operation measures the time it takes for the NQA client to establish a TCP connection to a specific port on the NQA server. The TCP operation requires both the NQA server and the NQA client. Before you perform a TCP operation, configure a TCP listening service on the NQA server. For more information about the TCP listening service configuration, see "Configuring the NQA server." To configure a TCP operation: Step Command Remarks 1. Enter system view.
Step Command Remarks 1. Enter system view. system-view N/A 2. Create an NQA operation and enter NQA operation view. nqa entry admin-name operation-tag By default, no NQA operation exits. 3. Specify the UDP echo type and enter its view. type udp-echo N/A By default, no destination IP address is configured. 4. Configure the destination address of UDP packets. destination ip ip-address By default, no destination port number is configured. 5. Configure the destination port of UDP packets.
Step Command Remarks N/A 3. Specify an NQA operation type and enter its view. type { dhcp | ftp | http | icmp-echo | snmp | tcp | udp-echo | udp-jitter } 4. Configure a description. description text Optional. By default, no description is configured. Optional. 5. Specify the interval at which the NQA operation repeats. frequency interval Specify the probe times. probe count times By default, the interval is 0 milliseconds. Only one operation is performed.
Step Command Remarks 2. Create an NQA operation and enter NQA operation view. nqa entry admin-name operation-tag By default, no NQA operation exits. 3. Specify an NQA operation type and enter its view. type { dhcp | ftp | http | icmp-echo | snmp | tcp | udp-echo } The collaboration function is not available for the UDP jitter operations. 4. Configure a reaction entry. reaction item-number checked-element probe-fail threshold-type consecutive consecutive-occurrences action-type trigger-only 5.
{ If the threshold is violated, the state of the entry is set to over-threshold. Otherwise, the state of the entry is set to below-threshold. If the action to be triggered is configured as trap-only for a reaction entry, when the state of the entry changes, a trap message is generated and sent to the NMS. Configuration prerequisites Before you configure threshold monitoring, configure the destination address of the trap messages by using the snmp-agent target-host command.
Step Command Remarks • Enable sending traps to the NMS when specified conditions are met: reaction trap { probe-failure consecutive-probe-failures | test-complete | test-failure cumulate-probe-failures } • Configure a reaction entry for monitoring the duration of an NQA operation (not supported in the UDP jitter operation): reaction item-number checked-element probe-duration threshold-type { accumulate accumulate-occurrences | average | consecutive consecutive-occurrences } threshold-value upper-thresh
The DHCP operation does not support the NQA statistics function. If you use the frequency command to set the interval between two consecutive operations to 0, only one operation is performed, and no statistics group information is generated. To configure the NQA statistics collection function: Step Command Remarks 1. Enter system view. system-view N/A 2. Create an NQA operation and enter NQA operation view. nqa entry admin-name operation-tag By default, no NQA operation exits. 3.
Step 4. Enable saving history records for the NQA operation. Command Remarks history-record enable By default, this feature is not enabled. Optional. 5. Set the lifetime of history records. 6. Configure the maximum number of history records that can be saved. history-record keep-time keep-time By default, history records in the NQA operation are kept for 120 minutes. Optional. history-record number number By default, the maximum number of records that can be saved for the NQA operation is 50.
Task Command Remarks Display the current monitoring results of reaction entries. display nqa reaction counters [ admin-name operation-tag [ item-number ] ] [ | { begin | exclude | include } regular-expression ] Available in any view. Display the result of the specified NQA operation. display nqa result [ admin-name operation-tag ] [ | { begin | exclude | include } regular-expression ] Available in any view. Display NQA statistics.
Figure 7 Network diagram Configuration procedure # Assign each interface an IP address. (Details not shown.) # Configure static routes or a routing protocol to make sure the devices can reach each other. (Details not shown.) # Create an ICMP echo test operation, and specify 10.2.2.2 as the destination address. system-view [AC] nqa entry admin test [AC-nqa-admin-test] type icmp-echo [AC-nqa-admin-test-icmp-echo] destination ip 10.2.2.2 # Configure 10.1.1.2 as the next hop IP.
# Stop the ICMP echo operation after a period of time. [AC] undo nqa schedule admin test # Display the results of the ICMP echo operation. [AC] display nqa result admin test NQA entry (admin admin, tag test) test results: Destination IP address: 10.2.2.2 Send operation times: 10 Receive response times: 10 Min/Max/Average round trip time: 2/5/3 Square-Sum of round trip time: 96 Last succeeded probe time: 2013-08-23 15:00:01.
Figure 8 Network diagram Configuration procedure # Create a DHCP operation to be performed on interface VLAN-interface 2. system-view [AC] nqa entry admin test [AC-nqa-admin-test] type dhcp [AC-nqa-admin-test-dhcp] operation interface vlan-interface 2 # Enable the saving of history records. [AC-nqa-admin-test-dhcp] history-record enable [AC-nqa-admin-test-dhcp] quit # Start the DHCP operation.
FTP operation configuration example Network requirements As shown in Figure 9, configure an FTP operation to test the time required for AC to upload a file to the FTP server. The login username and the login password are admin and systemtest, respectively. The file to be transferred to the FTP server is config.txt. Figure 9 Network diagram Configuration procedure # Assign each interface an IP address. (Details not shown.
Min/Max/Average round trip time: 173/173/173 Square-Sum of round trip time: 29929 Last succeeded probe time: 2013-8-22 10:07:28.6 Extended results: Packet loss in test: 0% Failures due to timeout: 0 Failures due to disconnect: 0 Failures due to no connection: 0 Failures due to sequence error: 0 Failures due to internal error: 0 Failures due to other errors: 0 Packet(s) arrived late: 0 # Display the history records of the FTP operation.
[AC-nqa-admin-test-http] url /index.htm # Configure the operation to use HTTP version 1.0. By default, the HTTP operation uses HTTP 1.0. [AC-nqa-admin-test-http] http-version v1.0 # Enable the saving of history records. [AC-nqa-admin-test-http] history-record enable [AC-nqa-admin-test-http] quit # Start the HTTP operation. [AC] nqa schedule admin test start-time now lifetime forever # Stop the HTTP operation after a period of time.
Configuration procedure 1. Assign each interface an IP address. (Details not shown.) 2. Configure static routes or a routing protocol to make sure the devices can reach each other. (Details not shown.) 3. Configure Device: # Enable the NQA server. system-view [Device] nqa server enable # Configure a listening service to listen on the IP address 10.2.2.2 and UDP port 9000. [Device] nqa server udp-echo 10.2.2.2 9000 4. Configure AC: # Create a UDP jitter operation.
Max positive SD: 21 Max positive DS: 28 Positive SD number: 5 Positive DS number: 4 Positive SD sum: 52 Positive DS sum: 38 Positive SD average: 10 Positive DS average: 10 Positive SD square sum: 754 Positive DS square sum: 460 Min negative SD: 1 Min negative DS: 6 Max negative SD: 13 Max negative DS: 22 Negative SD number: 4 Negative DS number: 5 Negative SD sum: 38 Negative DS sum: 52 Negative SD average: 10 Negative DS average: 10 Negative SD square sum: 460 Negative DS square sum: 7
Negative SD number: 181 Negative DS number: 209 Negative SD sum: 181 Negative DS sum: 209 Negative SD average: 13 Negative DS average: 14 Negative SD square sum: 46994 Negative DS square sum: 3030 One way results: Max SD delay: 46 Max DS delay: 46 Min SD delay: 7 Min DS delay: 7 Number of SD delay: 410 Number of DS delay: 410 Sum of SD delay: 3705 Sum of DS delay: 3891 Square sum of SD delay: 45987 Square sum of DS delay: 49393 SD lost packet(s): 0 DS lost packet(s): 0 Lost packet(s) for
# Start the SNMP operation. [AC] nqa schedule admin test start-time now lifetime forever # Stop the SNMP operation after a period of time. [AC] undo nqa schedule admin test # Display the results of the SNMP operation. [AC] display nqa result admin test NQA entry (admin admin, tag test) test results: Destination IP address: 10.2.2.
system-view [Device] nqa server enable # Configure a listening service to listen on the IP address 10.2.2.2 and TCP port 9000. [Device] nqa server tcp-connect 10.2.2.2 9000 4. Configure AC: # Create a TCP operation. system-view [AC] nqa entry admin test [AC-nqa-admin-test] type tcp # Configure 10.2.2.2 as the destination IP address and port 9000 as the destination port. [AC-nqa-admin-test-tcp] destination ip 10.2.2.
UDP echo operation configuration example Network requirements As shown in Figure 14, configure a UDP echo operation to test the round-trip time between AC and Device. The destination port number is 8000. Figure 14 Network diagram Configuration procedure 1. Assign each interface an IP address. (Details not shown.) 2. Configure static routes or a routing protocol to make sure the devices can reach each other. (Details not shown.) 3. Configure Device: # Enable the NQA server.
Extended results: Packet loss in test: 0% Failures due to timeout: 0 Failures due to disconnect: 0 Failures due to no connection: 0 Failures due to sequence error: 0 Failures due to internal error: 0 Failures due to other errors: 0 Packet(s) arrived late: 0 # Display the history records of the UDP echo operation. [AC] display nqa history admin test NQA entry (admin admin, tag test) history record(s): Index Response Status Time 1 25 Succeeded 2013-8-22 10:36:17.
# Configure the operation to repeat at an interval of 100 milliseconds. [AC1-nqa-admin-test-icmp-echo] frequency 100 # Create reaction entry 1. If the number of consecutive probe failures reaches 5, collaboration is triggered. [AC1-nqa-admin-test-icmp-echo] reaction 1 checked-element probe-fail threshold-type consecutive 5 action-type trigger-only [AC1-nqa-admin-test-icmp-echo] quit # Start the ICMP echo operation. [AC1] nqa schedule admin test start-time now lifetime forever 4.
NQA entry: admin test Reaction: 1 # Display brief information about active routes in the routing table on AC 1. [AC1] display ip routing-table Routing Tables: Public Destinations : 4 Destination/Mask Proto 10.2.1.0/24 Routes : 4 Pre Cost NextHop Interface Direct 0 0 10.2.1.2 Vlan3 10.2.1.2/32 Direct 0 0 127.0.0.1 InLoop0 127.0.0.0/8 Direct 0 0 127.0.0.1 InLoop0 127.0.0.1/32 Direct 0 0 127.0.0.
Configuring NTP Synchronize your device with a trusted time source either by using the Network Time Protocol (NTP), or changing the system time before you use the device on a live network. Various tasks, including network management, charging, auditing, and distributed computing depend on an accurate system time setting, because the timestamps of system messages and logs use the system time. Overview NTP is typically used in large networks to dynamically synchronize time among network devices.
• Device B is used as the NTP server. Device A is to be synchronized to Device B. • It takes 1 second for an NTP message to travel from Device A to Device B, and from Device B to Device A. Figure 16 Basic work flow of NTP The synchronization process is as follows: 1. Device A sends Device B an NTP message, which is timestamped when it leaves Device A. The timestamp is 10:00:00 am (T1). 2. When this NTP message arrives at Device B, it is timestamped by Device B. The timestamp is 11:00:01 am (T2). 3.
NTP uses two types of messages: clock synchronization messages and NTP control messages. NTP control messages are used in environments where network management is needed. Because NTP control messages are not essential for clock synchronization, they are not described in this document. A clock synchronization message is encapsulated in a UDP message, as shown in Figure 17. Figure 17 Clock synchronization message format The fields are described as follows: • LI (Leap Indicator)—A 2-bit leap indicator.
• Precision—An 8-bit signed integer that indicates the precision of the local clock. • Root Delay—Roundtrip delay to the primary reference source. • Root Dispersion—The maximum error of the local clock relative to the primary reference source. • Reference Identifier—Identifier of the particular reference source. • Reference Timestamp—The local time at which the local clock was most recently set or corrected.
Symmetric peers mode Figure 19 Symmetric peers mode In symmetric peers mode, devices that operate in symmetric active mode and symmetric passive mode exchange NTP messages with the Mode field 3 (client mode) and 4 (server mode). The device that operates in symmetric active mode periodically sends clock synchronization messages, with the Mode field in the messages set to 1 (symmetric active).
Multicast mode Figure 21 Multicast mode In multicast mode, the server periodically sends clock synchronization messages to the user-configured multicast address, with the Mode field set to 5 (multicast mode). If no multicast address is configured, the server sends messages to the default NTP multicast address 224.0.1.1.
Configuring NTP client/server mode A device can act as a server to synchronize other devices only after it is synchronized. If a server has a stratum level higher than or equal to a client, the client does not synchronize to that server. To specify an NTP server on the client: Step Enter system view. 1. Command Remarks system-view N/A By default, no NTP server is specified. Specify an NTP server for the device. 2.
Step Command Remarks By default, no symmetric-passive peer is specified. Specify a symmetric-passive peer for the device. 2. ntp-service unicast-peer { ip-address | peer-name } [ authentication-keyid keyid | priority | source-interface interface-type interface-number | version number ] * After you specify the source interface for NTP messages, the source IP address of the NTP messages is set as the primary IP address of the specified interface.
Step Configure the device to operate in NTP broadcast server mode. 3. Command Remarks ntp-service broadcast-server [ authentication-keyid keyid | version number ] * A broadcast server can synchronize broadcast clients only when its clock has been synchronized. Configuring NTP multicast mode The multicast server periodically sends NTP multicast messages to multicast clients, which send replies after receiving the messages and synchronize their local clocks.
Typically, the stratum level of the NTP server that is synchronized from an authoritative clock (such as an atomic clock) is set to 1. This NTP server operates as the primary reference source on the network, and other devices synchronize to it. The number of NTP hops between a device and the primary reference source determines the stratum level of the device. If you configure the local clock as a reference clock, the local device can act as a reference clock to synchronize other devices in the network.
Disabling an interface from receiving NTP messages If NTP is enabled, NTP messages can be received from all the interfaces by default. To disable an interface from receiving NTP messages: Step Command Remarks 1. Enter system view. system-view N/A 2. Enter interface view. interface interface-type interface-number N/A 3. Disable the interface from receiving NTP messages. ntp-service in-interface disable By default, an interface is enabled to receive NTP messages.
Configuring access-control rights NTP service access-control rights are peer, server, synchronization, and query, from highest to lowest. When the device receives an NTP message, it performs an access-control right match and uses the first matching right to process the message. If no matching right is found, the device drops the NTP message. • Query—Control query permitted.
• Configure an authentication key. • Configure the key as a trusted key. • Associate the specified key with an NTP server or a symmetric peer. Configuring NTP authentication in client/server mode When configuring NTP authentication in client/server mode, follow these guidelines: • A client can synchronize to the server only when you configure all the required tasks on both the client and server.
Step 3. 4. Command Configure an NTP authentication key. ntp-service authentication-keyid keyid authentication-mode md5 [ cipher | simple ] value Configure the key as a trusted key. ntp-service reliable authentication-keyid keyid Remarks By default, no NTP authentication key is configured. Configure the same authentication key on the client and server. By default, no authentication key is configured to be trusted.
Configuring NTP authentication for a passive peer Step Command Remarks 1. Enter system view. system-view N/A 2. Enable NTP authentication. ntp-service authentication enable By default, NTP authentication is disabled. 3. Configure an NTP authentication key. ntp-service authentication-keyid keyid authentication-mode md5 [ cipher | simple ] value 4. Configure the key as a trusted key. ntp-service reliable authentication-keyid keyid By default, no NTP authentication key is configured.
Step Command Remarks 4. Configure the key as a trusted key. ntp-service reliable authentication-keyid keyid By default, no authentication key is configured to be trusted. 5. Enter interface view. interface interface-type interface-number N/A ntp-service broadcast-server authentication-keyid keyid You can associate a non-existing key with the broadcast server.
Step Enter interface view. 5. Associate the specified key with the multicast server. 6. Command Remarks interface interface-type interface-number N/A ntp-service multicast-server authentication-keyid keyid You can associate a non-existing key with the multicast server. To enable NTP authentication, you must configure the key and specify it as a trusted key after associating the key with the multicast server.
• Configure the AC to operate in client/server mode, and specify the switch as the NTP server of the AC. Figure 22 Network diagram Configuration procedure 1. Set the IP address for each interface as shown in Figure 22. (Details not shown.) 2. Configure the switch: # Specify the local clock as the reference source, with the stratum level 2. system-view [Switch] ntp-service refclock-master 2 3. Configure the AC: # Display the NTP status of the AC before clock synchronization.
[AC] display ntp-service sessions source reference stra reach poll now offset delay disper ************************************************************************** [12345] 1.0.1.11 127.127.1.0 2 63 64 3 -75.5 31.0 16.
AC 1 and AC 2 are configured as symmetric peers, with AC 2 in the symmetric-active mode and AC 1 in the symmetric-passive mode. Because the stratum level of AC 2 is 1 while that of AC 1 is 3, AC 1 synchronizes to AC 2. # Verify that AC 1 has synchronized to AC 2, and the clock stratum level is 2 on AC 1 and 1 on AC 2. [AC1] display ntp-service status Clock status: synchronized Clock stratum: 2 Reference clock ID: 3.0.1.33 Nominal frequency: 100.0000 Hz Actual frequency: 100.
Figure 24 Network diagram Configuration procedure 1. Set the IP address for each interface as shown in Figure 24. (Details not shown.) 2. Configure AC 2: # Specify the local clock as the reference source, with the stratum level 2. system-view [AC2] ntp-service refclock-master 2 # Configure AC 2 to operate in broadcast server mode and send broadcast messages through VLAN-interface 2. [AC2] interface vlan-interface 2 [AC2-Vlan-interface2] ntp-service broadcast-server 3.
Actual frequency: 100.0000 Hz Clock precision: 2^18 Clock offset: 0.0000 ms Root delay: 31.00 ms Root dispersion: 8.31 ms Peer dispersion: 34.30 ms Reference time: 16:01:51.713 UTC Sep 19 2013 (C6D95F6F.B6872B02) # Verify that an NTP association has been established between AC 3 and AC 2. [AC3-Vlan-interface2] display ntp-service sessions source reference stra reach poll now offset delay disper ************************************************************************** [1234] 3.0.1.31 127.127.1.
[AC2] ntp-service refclock-master 2 # Configure AC 2 to operate in multicast server mode and send multicast messages through VLAN-interface 2. [AC2] interface vlan-interface 2 [AC2-Vlan-interface2] ntp-service multicast-server 3. Configure AC 3: # Configure AC 3 to operate in multicast client mode and receive multicast messages on VLAN-interface 2.
[Switch-vlan3] quit [Switch] interface vlan-interface 3 [Switch-Vlan-interface3] igmp enable [Switch-Vlan-interface3] quit [Switch] interface gigabitethernet 1/0/1 [Switch-GigabitEthernet1/0/1] igmp-snooping static-group 224.0.1.1 vlan 3 5. Configure AC 1: system-view [AC1] interface vlan-interface 3 # Configure AC 1 to operate in multicast client mode and receive multicast messages on VLAN-interface 3.
Figure 26 Network diagram Configuration procedure 1. Set the IP address for each interface as shown in Figure 26. (Details not shown.) 2. Configure the switch: # Specify the local clock as the reference source, with the stratum level 2. system-view [Switch] ntp-service refclock-master 2 3. Configure the AC: system-view # Enable NTP authentication on the AC. [AC] ntp-service authentication enable # Set an authentication key.
[AC] display ntp-service sessions source reference stra reach poll now offset delay disper ************************************************************************** [12345] 1.0.1.11 127.127.1.0 2 63 64 3 -75.5 31.0 16.
# Enable NTP authentication on AC 3. Configure an NTP authentication key, with the key ID of 88 and key value of 123456. Specify the key as a trusted key. system-view [AC3] ntp-service authentication enable [AC3] ntp-service authentication-keyid 88 authentication-mode md5 123456 [AC3] ntp-service reliable authentication-keyid 88 # Configure AC 3 to operate in broadcast client mode and receive NTP broadcast messages on VLAN-interface 2.
Actual frequency: 100.0000 Hz Clock precision: 2^18 Clock offset: 0.0000 ms Root delay: 0.00 ms Root dispersion: 0.00 ms Peer dispersion: 0.00 ms Reference time: 00:00:00.000 UTC Jan 1 1900(00000000.00000000) # Enable NTP authentication on AC 2. Configure an NTP authentication key, with the key ID of 88 and key value of 123456. Specify the key as a trusted key.
Root dispersion: 8.31 ms Peer dispersion: 34.30 ms Reference time: 16:01:51.713 UTC Sep 19 2013 (C6D95F6F.
Configuring IPC This chapter provides an overview of inter-process communication (IPC) and describes the IPC monitoring commands. Support for this feature depends on the device model. For more information, see About the Configuration Guides for HP Unified Wired-WLAN Products. Overview IPC provides a reliable communication mechanism among processing units, typically CPUs. IPC is typically used on a distributed device or in an IRF fabric to provide reliable inter-card or inter-device transmission.
C ha nn el 2 Figure 28 Relationship between a node, link and channel Link Packet sending modes IPC uses one of the following modes to send packets for upper layer application modules: • Unicast—One node sends packets to another node. • Multicast—One node sends packets to several other nodes. This mode includes broadcast, a special multicast. To use multicast mode, an application module must create a multicast group that includes a set of nodes.
Displaying and maintaining IPC Task Command Remarks Display IPC node information. display ipc node [ | { begin | exclude | include } regular-expression ] Available in any view. Display channel information for a node. display ipc channel { node node-id | self-node } [ | { begin | exclude | include } regular-expression ] Available in any view. Display queue information for a node.
Configuring SNMP This chapter provides an overview of the Simple Network Management Protocol (SNMP) and guides you through the configuration procedure. Overview SNMP is an Internet standard protocol widely used for a management station to access and operate the devices on a network, regardless of their vendors, physical characteristics, and interconnect technologies.
Figure 30 MIB tree A MIB view represents a set of MIB objects (or MIB object hierarchies) with certain access privileges and is identified by a view name. The MIB objects included in the MIB view are accessible, and those excluded from the MIB view are inaccessible. A MIB view can have multiple view records each identified by a view-name oid-tree pair. You control access to the MIB by assigning MIB views to SNMP groups or communities.
Task Remarks Configuring SNMP traps Optional. Setting the sampling interval and statistics interval for certain MIB nodes Optional. Configuring the SNMP proxy agent for an SNMP agent Optional. Configuring SNMP basic parameters SNMPv3 differs from SNMPv1 and SNMPv2c in many ways. Their configuration procedures are described in separate sections. Configuring SNMPv3 basic parameters Step 1. Enter system view. Command Remarks system-view N/A Optional. By default, the SNMP agent is disabled. 2.
Step Command Remarks Optional. By default, the MIB view ViewDefault is predefined and its OID is 1. Create or update a MIB view. snmp-agent mib-view { excluded | included } view-name oid-tree [ mask mask-value ] Configure an SNMPv3 group. snmp-agent group v3 group-name [ authentication | privacy ] [ read-view read-view ] [ write-view write-view ] [ notify-view notify-view ] [ acl acl-number | acl ipv6 ipv6-acl-number ] * Convert a plaintext key to a ciphertext (encrypted) key.
Step Command Remarks Optional. By default, the SNMP agent is disabled. You can also enable the SNMP agent service by using any command that begins with snmp-agent except for the snmp-agent calculate-password command. 2. Enable the SNMP agent. snmp-agent 3. Configure system information for the SNMP agent. snmp-agent sys-info { contact sys-contact | location sys-location | version { all |{ v1 | v2c | v3 }* } } 4. Configure the local engine ID.
Step Command Configure the maximum SNMP packet size (in bytes) that the SNMP agent can handle. 7. Remarks Optional. snmp-agent packet max-size byte-count By default, the maximum SNMP packet size that the SNMP agent can handle is 2000 bytes. Configuring SNMP logging If the device is operating correctly, disable SNMP logging to prevent a large amount of SNMP logs from decreasing device performance.
To generate linkUp or linkDown traps when the link state of an interface changes, enable the linkUp or linkDown trap function both globally by using the snmp-agent trap enable [ standard [ linkdown | linkup ] * ] command and on the interface by using the enable snmp trap updown command. After you enable a trap function for a module, whether the module generates traps also depends on the configuration of the module. For more information, see the configuration guide for each module.
Step Command Remarks Optional. By default, standard linkUp/linkDown traps are used. 4. Extend the standard linkUp/linkDown traps. snmp-agent trap if-mib link extended Extended linkUp/linkDown traps add interface description and interface type to standard linkUp/linkDown traps. If the NMS does not support extended SNMP messages, use standard linkUp/linkDown traps. Optional. 5. Configure the trap queue size. snmp-agent trap queue-size size The default trap queue size is 1000.
To make sure the system performs at least one data poll for each statistics interval, set the statistics interval equal to or greater than the sampling interval. Configuring the SNMP proxy agent for an SNMP agent The SNMP proxy agent function is designed for access controllers installed with a SecBlade IAG card. The function enables the access controller to communicate with the SNMP NMS on behalf of the SecBlade IAG card and transparently forwards SNMP messages to the SecBlade IAG card.
Task Command Remarks Display SNMPv3 user information. display snmp-agent usm-user [ engineid engineid | username user-name | group group-name ] * [ | { begin | exclude | include } regular-expression ] Available in any view. Display SNMPv1 or SNMPv2c community information. display snmp-agent community [ read | write ] [ | { begin | exclude | include } regular-expression ] Available in any view. Display MIB view information.
[AC] snmp-agent sys-info version v1 v2c [AC] snmp-agent community read public [AC] snmp-agent community write private # Configure contact and physical location information for the AC. [AC] snmp-agent sys-info contact Mr.Wang-Tel:3306 [AC] snmp-agent sys-info location telephone-closet,3rd-floor # Enable SNMP traps, set the NMS at IP address 1.1.1.2/24 as an SNMP trap destination, and use public as the community name.
The NMS and the agent perform authentication when they establish an SNMP session. The authentication algorithm is MD5, and the authentication key is authkey. The NMS and the agent also encrypt the SNMP packets between them by using the DES algorithm and the privacy key prikey. Figure 32 Network diagram Configuration procedure 1. Configure the agent: # Configure the IP address of the agent and make sure the agent and the NMS can reach each other. (Details not shown.
3. Verify the configuration: # Try to get the count of sent traps from the agent. The get attempt succeeds. Send request to 1.1.1.1/161 ... Protocol version: SNMPv3 Operation: Get Request binding: 1: 1.3.6.1.2.1.11.29.0 Response binding: 1: Oid=snmpOutTraps.0 Syntax=CNTR32 Value=18 Get finished # Try to get the device name from the agent. The get attempt fails because the NMS has no access right to the node. Send request to 1.1.1.1/161 ... Protocol version: SNMPv3 Operation: Get Request binding: 1: 1.3.6.
Configuration procedure This example assumes that you have configured all required SNMP settings for the NMS and the agent (see "SNMPv1/SNMPv2c configuration example" or "SNMPv3 configuration example"). # Enable displaying log messages on the configuration terminal. (This function is enabled by default. Skip this step if you are using the default.
Configuring RMON Overview Remote Monitoring (RMON) is an enhancement to SNMP for remote device management and traffic monitoring. An RMON monitor, typically the RMON agent embedded in a network device, periodically or continuously collects traffic statistics for the network attached to a port, and when a statistic crosses a threshold, logs the crossing event and sends a trap to the management station. RMON uses SNMP traps to notify NMSs of exceptional conditions.
History group The history group defines that the system periodically collects traffic statistics on interfaces and saves the statistics in the history record table (ethernetHistoryTable). The statistics include bandwidth utilization, number of error packets, and total number of packets. The history statistics table record traffic statistics collected for each sampling interval. The sampling interval is user-configurable.
Private alarm group The private alarm group calculates the values of alarm variables and compares the results with the defined threshold for a more comprehensive alarming function. The system handles the private alarm entry (as defined by the user) in the following ways: • Periodically samples the private alarm variables defined in the private alarm formula. • Calculates the sampled values based on the private alarm formula.
• You can configure multiple history control entries for one interface, but you must make sure their entry numbers and sampling intervals are different. • The device supports up to 100 history control entries. • You can successfully create a history control entry, even if the specified bucket size exceeds the history table size supported by the device. However, the effective bucket size will be the actual value supported by the device.
Step Command Remarks • Create an entry in the alarm table: 3. Create an entry in the alarm table or private alarm table.
Task Command Remarks Display log information for event entries. display rmon eventlog [ entry-number ] [ | { begin | exclude | include } regular-expression ] Available in any view. RMON configuration examples The configuration examples were created on the 11900/10500/7500 20G unified wired-WLAN module and might vary by device models.
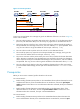
etherStatsBroadcastPkts : 56 , etherStatsMulticastPkts : 34 etherStatsUndersizePkts : 0 , etherStatsOversizePkts : 0 etherStatsFragments : 0 , etherStatsJabbers : 0 , etherStatsCollisions : 0 etherStatsCRCAlignErrors : 0 etherStatsDropEvents (insufficient resources): 0 Packets received according to length: 64 : 235 256-511: 1 , 65-127 , 512-1023: 0 : 67 , 128-255 , 1024-1518: 0 : 4 # On the configuration terminal, get the traffic statistics through SNMP. (Details not shown.
packets : 10 , broadcast packets : 3 multicast packets : 6 , CRC alignment errors : 0 undersize packets : 0 , oversize packets : 0 fragments : 0 , jabbers : 0 collisions : 0 , utilization : 0 Sampled values of record 3 : dropevents : 0 , octets : 830 packets : 8 , broadcast packets : 0 multicast packets : 6 , CRC alignment errors : 0 undersize packets : 0 , oversize packets : 0 fragments : 0 , jabbers : 0 collisions : 0 , utilization : 0 Sampled values of record 4 : dro
Alarm group configuration example Network requirements Configure the RMON alarm group on the RMON agent in Figure 37 to send alarms in traps when the 5-second incoming traffic statistic on Ten-GigabitEthernet 1/0/1 crosses the rising threshold or drops below the falling threshold. Figure 37 Network diagram Configuration procedure # Configure the SNMP agent with the same SNMP settings as the NMS at 1.1.1.2. This example uses SNMPv1, read community public, and write community private.
Latest value : 0 # Display statistics for Ten-GigabitEthernet 1/0/1. display rmon statistics ten-gigabitethernet 1/0/1 EtherStatsEntry 1 owned by user1-rmon is VALID. Interface : Ten-GigabitEthernet1/0/1
Configuring the information center The information center on a device classifies and manages system information for all modules so that network administrators can monitor network performance and troubleshoot network problems. Overview The information center receives system information generated by source modules and outputs the information to different destinations according to user-defined output rules. You can classify, filter, and output system information based on source modules.
Table 4 System information levels Severity Severity value Description Corresponding keyword in commands Emergency 0 The system is unusable. For example, the system authorization has expired. emergencies Alert 1 Action must be taken immediately to solve a serious problem. For example, traffic on an interface exceeds the upper limit. alerts Critical 2 Critical condition. For example, the device temperature exceeds the upper limit, the power module fails or the fan tray fails.
Channel number Default channel name Default output destination System information received by default 7 channel7 Not specified Log, trap, and debug information 8 channel8 Not specified Log, trap, and debug information 9 channel9 Log file Log, trap, and debug information Default output rules of system information A default output rule specifies the system information source modules, information type, and severity levels for an output destination. Table 6 shows the default output rules.
Formats The system information formats vary with output destinations. See Table 7. Table 7 System information formats Output destination Format Example Console, monitor terminal, logbuffer, trapbuffer, SNMP module, or log file timestamp sysname module/level/digest: content %Jun 26 17:08:35:809 2013 Sysname SHELL/4/LOGIN: VTY login from 1.1.1.1.
Field Description Module This field specifies source module name. You can execute the info-center source ? command in system view to view the module list. Level (severity) System information is divided into eight severity levels, from 0 to 7. See Table 4 for more information about severity levels. You cannot change the system information levels generated by modules. However, you can use the info-center source command to control the output of system information based on severity levels.
Timestamp parameters date Description Example Current date and time, in the format of mm dd hh:mm:ss:xxx yyy. %May 30 05:36:29:579 2013 Sysname FTPD/5/FTPD_LOGIN: User ftp (192.168.1.23) has logged in successfully. All system information supports this parameter. Timestamp format stipulated in ISO 8601. iso Only system information that is sent to the log host supports this parameter. No timestamp is included. none no-year-date All system information supports this parameter.
Outputting system information to the console Step Command Remarks N/A 1. Enter system view. system-view 2. Enable the information center. info-center enable 3. Name the channel with a specified channel number. info-center channel channel-number name channel-name 4. Configure an output channel for the console. info-center console channel { channel-number | channel-name } 5. Configure an output rule for the console.
Step Command Remarks N/A 1. Enter system view. system-view 2. Enable the information center. info-center enable 3. Name the channel with a specified channel number. info-center channel channel-number name channel-name Configure an output channel for the monitor terminal. info-center monitor channel { channel-number | channel-name } 5. Configure an output rule for the monitor terminal.
Step 2. 3. 4. Command Remarks Enable the information center. info-center enable Name the channel with a specified channel number. info-center channel channel-number name channel-name Configure an output rule for the log host. info-center source { module-name | default } channel { channel-number | channel-name } [ debug { level severity | state state } * | log { level severity | state state } * | trap { level severity | state state } * ] * Optional. Enabled by default. Optional.
Step Command Remarks Optional. 3. Name the channel with a specified channel number. info-center channel channel-number name channel-name 4. Configure an output channel for the trap buffer and set the buffer size. info-center trapbuffer [ channel { channel-number | channel-name } | size buffersize ] * 5. Configure an output rule for the trap buffer.
Step Command Remarks Optional. 6. Configure the timestamp format. info-center timestamp { debugging | log | trap } { boot | date | none } The timestamp format for log, trap and debug information is date by default. Outputting system information to the SNMP module The SNMP module only receives trap information, and discards log and debug information. To monitor the device running status, trap information is usually sent to the SNMP network management system (NMS).
system information by clicking corresponding tabs after logging in to the device through the Web interface. To output system information to the Web interface: Step Command Remarks N/A 1. Enter system view. system-view 2. Enable the information center. info-center enable 3. Name the channel with a specified channel number. info-center channel channel-number name channel-name 4. Configure an output channel for the Web interface. info-center syslog channel { channel-number | channel-name } 5.
Step Command Remarks N/A 1. Enter system view. system-view 2. Enable the information center. info-center enable 3. Enable the log file feature. info-center logfile enable 4. Configure the interval at which the system saves information to the log fie. info-center logfile frequency freq-sec Optional. Enabled by default. Optional. Enabled by default. Optional. The default saving interval is 86400 seconds. Optional. 5. Enable log file overwrite-protection.
output and a command prompt in command editing mode, or a [Y/N] string in interaction mode so you can continue your operation from where you were stopped. If system information, such as log information, is output before you input any information under the current command line prompt, the system does not display the command line prompt after the system information output.
• You are concerned only about the states of some ports. In this case, you can use this function to disable other ports from generating link up and link down logs. • A port is unstable and continuously outputs log information. In this case, you can disable the port from generating link up and link down logs. Use the default setting in normal cases to avoid affecting port status monitoring. To disable a port from generating link up or link down logs: Step Command Remarks 1. Enter system view.
Task Command Remarks Clear the trap buffer. reset trapbuffer Available in user view. Information center configuration examples The configuration examples were created on the 11900/10500/7500 20G unified wired-WLAN module and might vary with device models. When configuring the 11900/10500/7500 20G unified wired-WLAN module, make sure the settings are correct (including VLAN settings) on the internal Ethernet interface that connects the module to the switch.
terminal monitor Info: Current terminal monitor is on. terminal logging Info: Current terminal logging is on. Now, if the ARP and IP modules generate log information, the information center automatically sends the log information to the console. Outputting log information to a UNIX log host Network requirements Configure the AC to send ARP and IP log information that has a severity level of at least informational to the UNIX log host at 1.2.0.1/16.
c. Edit the file syslog.conf in directory /etc/ and add the following contents. # AC configuration messages local4.info /var/log/AC/info.log In this configuration, local4 is the name of the logging facility that the log host uses to receive logs. info is the informational level. The UNIX system records the log information that has a severity level of at least informational to the file /var/log/AC/info.log. NOTE: Be aware of the following issues while editing file /etc/syslog.
[Sysname] info-center source default channel loghost log level informational state on debug state off trap state off 2. Configure the log host: a. Log in to the log host as a root user. b. Create a subdirectory named AC in the directory /var/log/, and create file info.log in the AC directory to save logs from the AC. # mkdir /var/log/AC # touch /var/log/AC/info.log c. Edit the file syslog.conf in the directory /etc/ and add the following contents. # AC configuration messages local5.
Configuring flow logging Flow logging records users' access to external networks. The device classifies and calculates flows through 5-tuple information and generates flow logs. The 5-tuple information includes source IP address, destination IP address, source port, destination port, and protocol number. Flow logging records the 5-tuple information of packets and numbers of bytes received and sent. Flow logging has two versions: version 1.0 and version 3.0.
Field Description InTotalPkg Number of packets received. InTotalByte Number of bytes received. OutTotalPkg Number of packets sent. OutTotalByte Number of bytes sent. Reserved in version 0x02 (FirewallV200R001). Reserved1 In version 0x03 (FirewallV200R005), the first byte is the source VPN ID, the second byte is the destination VPN ID, and the third and forth bytes are reserved for future applications. Reserved2 For future applications. Reserved3 For future applications.
Configuring the source address for flow logging packets A source IP address is usually used to uniquely identify the sender of a packet. Suppose Device A sends flow logs to Device B. Device A uses the specified IP address instead of the actual egress address as the source IP address of the packets. In this way, although Device A sends out packets to Device B through different ports, Device B can judge whether the packets are sent from Device A according to their source IP addresses.
Step 2. Configure the IPv4 address and UDP port number of the log server. Command Remarks userlog flow export host ipv4-address udp-port Not configured by default. Command Remarks Exporting flow logs to an IPv6 log server Step 1. Enter system view. system-view N/A 2. Configure the IPv6 address and UDP port number of the log server. userlog flow export host ipv6 ipv6-address udp-port Not configured by default.
Figure 42 Network diagram Configuration procedure # Configure IP addresses for the interfaces according to the network diagram. Make sure the devices can reach each other. (Details not shown.) # Set the flow logging version to 3.0. system-view [Device] userlog flow export version 3 # Export flow logs to the log server with IP address 1.2.3.6:2000. [Device] userlog flow export host 1.2.3.6 2000 # Configure the source IP address of UDP packets carrying flow logs as 2.2.2.2.
Symptom 2: Flow logs cannot be exported to log server • Analysis: Both of the export approaches are configured. • Solution: Restore to the default, and then configure the IP address and UDP port number of the log server.
Configuring sFlow Sampled Flow (sFlow) is a traffic monitoring technology used to collect and analyze traffic statistics. As shown in Figure 43, the sFlow system involves an sFlow agent embedded in a device and a remote sFlow collector. The sFlow agent collects WLAN-DBSS interface counter information and packet content information and encapsulates the sampled information in sFlow packets.
sFlow configuration task list Task Remarks Configuring the sFlow agent and sFlow collector information Required. Configuring flow sampling Perform at least one of the tasks. Configuring counter sampling Configuring the sFlow agent and sFlow collector information Step 1. Enter system view. Command Remarks system-view N/A Optional. 2. Configure an IP address for the sFlow agent. sflow agent { ip ip-address | ipv6 ipv6-address } Not specified by default.
Step Command Remarks N/A 2. Enter WLAN-ESS interface view. interface interface-type interface-number 3. Set the flow sampling mode. sflow sampling-mode { determine | random } 4. Specify the number of packets out of which flow sampling samples a packet on the interface. sflow sampling-rate interval 5. 6. Optional. The default setting is random. By default, flow sampling samples a packet out of 2000 packets. Optional.
Enabling sFlow in radio view Step Command Remarks 1. Enter system view. system-view N/A 2. Enter AP template view. wlan ap ap-name [ model model-name [ id ap-id ] ] Model name of the AP must be provided when you create an AP template. 3. Enter radio view. radio radio-number [ type { dot11a | dot11an | dot11b | dot11g | dot11gn | dot11ac } ] The default setting varies by the AP. 4. Enable sFlow on an AP. sflow enable Optional. By default, sFlow is enabled on the AP.
Figure 44 Network diagram Eth1/1 3.3.3.1/16 Eth1/1 3.3.3.2/16 AC sFlow Collector Switch AP 1 AP 2 Client Client Configuration procedure 1. Configure the sFlow agent and sFlow collector: # Configure the IP address of the AC as 3.3.3.1. system-view [AC] sflow agent ip 3.3.3.1 # Specify sFlow collector ID 2, IP address 3.3.3.2, the default port number, and description of netserver for the sFlow collector. [AC] sflow collector 2 ip 3.3.3.2 description netserver 2.
sFlow Global Information: Agent IP:3.3.3.1(CLI) Source Address: Collector Information: ID IP 1 2 3.3.3.
Configuring port mirroring Support for this feature depends on the device model. For more information, see About the Configuration Guides for HP Unified Wired-WLAN Products. Overview Port mirroring refers to copying packets that are passing through a port to a monitor port that is connected to a monitoring device for packet analysis. Terminology Mirroring source The mirroring source can be one or more monitored ports of devices or cards.
The source device can act as the destination device to forward mirrored packets to the data monitoring device. • A mirroring group that contains the mirroring source and the mirroring destination on the device is called a "local mirroring group." Figure 45 Local port mirroring implementation As shown in Figure 45, the source port Ethernet 1/1 and the monitor port Ethernet 1/2 are on the same device. Packets received on Ethernet 1/1 are copied to Ethernet 1/2.
Configuring source ports for the local mirroring group You can configure a list of source ports for a mirroring group in system view. Also, you can assign a port to a mirroring group as a source port in interface view. The two methods have the same result. A mirroring group can contain multiple source ports. Configuring source ports for a local mirroring group in system view Step Command Remarks 1. Enter system view. system-view N/A 2. Configure source ports.
Configuring the monitor port of a local mirroring group in interface view Step Command Remarks 1. Enter system view. system-view N/A 2. Enter interface view. interface interface-type interface-number N/A 3. Configure the current port as the monitor port. [ mirroring-group group-id ] monitor-port By default, a port does not serve as the monitor port for any local mirroring groups. Displaying and maintaining port mirroring Task Command Remarks Display mirroring group information.
status: active mirroring port: GigabitEthernet1/0/1 both monitor port: GigabitEthernet1/0/2 133
Support and other resources Contacting HP For worldwide technical support information, see the HP support website: http://www.hp.
Conventions This section describes the conventions used in this documentation set. Command conventions Convention Description Boldface Bold text represents commands and keywords that you enter literally as shown. Italic Italic text represents arguments that you replace with actual values. [] Square brackets enclose syntax choices (keywords or arguments) that are optional. { x | y | ... } Braces enclose a set of required syntax choices separated by vertical bars, from which you select one.
Network topology icons Represents a generic network device, such as a router, switch, or firewall. Represents a routing-capable device, such as a router or Layer 3 switch. Represents a generic switch, such as a Layer 2 or Layer 3 switch, or a router that supports Layer 2 forwarding and other Layer 2 features. Represents an access controller, a unified wired-WLAN module, or the switching engine on a unified wired-WLAN switch. Represents an access point.
Index CDEFINOPRST C Displaying and maintaining NTP,58 Configuration example for NTP broadcast mode with authentication,67 Displaying and maintaining RMON,92 Configuration example for NTP client/server mode with authentication,65 Displaying and maintaining SNMP,82 Configuring access-control rights,53 E Configuring counter sampling,125 Enabling IPC performance statistics,72 Displaying and maintaining port mirroring,132 Displaying and maintaining sFlow,126 Configuring flow sampling,124 Enabling sFl
RMON configuration examples,93 Outputting system information to the Web interface,108 S Overview,71 Saving system information to the log file,109 Overview,9 Setting the sampling interval and statistics interval for certain MIB nodes,81 Overview,88 Overview,42 sFlow configuration example,126 Overview,129 sFlow configuration task list,124 Overview,98 SNMP configuration examples,83 Overview,74 SNMP configuration task list,75 P System debugging,5 Ping,1 T Ping and tracert example,7 Tracert,3