
HP Insight Virtualization Manager with Logical Server Management 6.1 User Guide

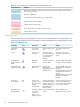
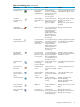
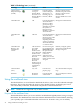

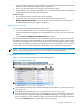
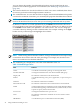


Table 3-3 Workload type values (continued)
DefinitionValue
The whole-OS workload on a generic virtual machine.Virtual Machine
The whole-OS workload on a virtual partition.Virtual Partition
The whole-OS workload on a VMware ESX virtual machine.VMware ESX VM
For a description of the types of workloads, see “Understanding workload types” (page 35).
7
The system on which the workload is defined. To examine the system properties, click the
system name (or IP address). This will display the SIM System Page for that system. This
field remains empty for parked workloads because the system property is set to “none”.
8
For managed workloads, this field displays the name of the gWLM policy associated with
the workload. To examine or modify the policy definition, click the policy name. This displays
the gWLM Create or Edit Policies screen for that policy. For servers and monitored workloads,
this field is displayed as “---”.
9
The real-time utilization metrics from each server and workload. This figure only shows the
CPU Utilization metric. In the actual screen, the other metrics appear to the right for memory
utilization, network I/O, and disk. You can view the historical data for any metric by clicking
its meter, which displays the Capacity Advisor Profile Viewer screen. If no data has been
collected yet, you can begin collecting data from that screen. For more information on the
Capacity Advisor, see the HP Insight Capacity Advisor 6.0 Software: User Guide.
An error indicator appears if there is a problem communicating with the managed system.
The utilization meters might show one of several error indicators instead of valid data. When
you hover the cursor over the error indicator, a message appears further explaining the
error.
Using the workload view 39