
HP StoreOnce Enterprise Manager User Guide

5 Accessing and viewing reports
The HP StoreOnce Enterprise Manager supports report and trending for the history data. The HP
StoreOnce Enterprise Manager shows a dashboard of overall appliance status, library status, NAS
share status, replication jobs, replication duration and size, object store status, forecast, disk usage,
and disk usage forecasting.
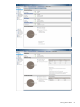
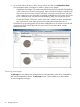
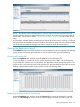
To view the reports, select Reports on the Navigation tree. The Dashboard is displayed by default.
Reports can be exported to a .csv file or a .png image by clicking Export to csv. You can schedule
a report by clicking Schedule an Email (see “Configuring a report scheduler” (page 25)).
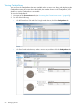
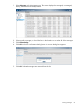
In all the reports, the For Last drop-down displays the data as follows:
• For last 24 Hours/1 Day, the report displays hourly aggregated values.
• For last 1 Week or 4 Weeks, the report displays daily aggregated values.
• For last All, the report displays monthly aggregated values.
In addition, in all the reports under Replication tab (Jobs, Slot Mapping Activity, and Cartridge
Activity) the “For Last” also displays the options of “8 Weeks” and “3 months” historic data.
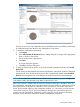
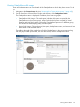
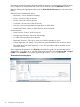
Viewing the dashboard
The Dashboard shows the historical report for a selected time period; the default is one day. Use
the For Last drop-down box to select a different time period.
The Dashboard also shows a summary of the groups and the total number of devices that belong
to each group. It shows the number of devices in the Critical, Warning, Unknown, and Good
statuses; click a number of devices to see more details. If there is a large amount of data displayed,
you can display a subset of data using the filters provided.
68 Accessing and viewing reports