
HP StoreOnce Enterprise Manager User Guide
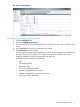
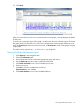

Viewing CatalystStores usage
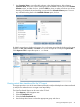
1. Select Reports in the Navigation tree.
2. Select the CatalystStores tab.
3. Select the Usage tab.
4. Use the drop-down boxes to select the appropriate group, device, service set, stores, type,
and time period to see the report.
On HP StoreOnce VSA and Gen3 single node devices, after a device is selected, the Service
Set drop-down box is disabled, and stores will be listed. Select stores, type, and time period
to see the report.
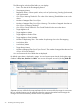
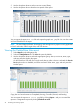
5. By default, inbound copy jobs are displayed. Click Copy Job (OutBound) to see the outbound
copy jobs.
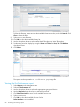
Inbound copy jobs are those received by the selected CatalystStore. Outbound copy jobs are
those initiated by the selected CatalystStore to other target CatalystStores.
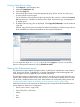
You can export the report as a .csv or .png file by clicking Export... and you can email the
report to a designated recipient by clicking Schedule an email.
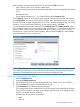
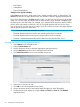
Viewing the Performance report
The performance reports display throughput values (in MB/sec) for selected service sets, libraries,
ports, drives, NAS shares, CatalystStores, or Teamed CatalystStores. Both read throughput and
write throughput values are graphed for the selected time period.
The throughput values are displayed for every minute. If you select a time period of less than two
months, data is displayed at the minute level. However, if the start date is greater than two months
old, the data is displayed at the hourly level. Administrators can change the polling interval (see
“Modifying the polling interval or IP address of an HP StoreOnce device” (page 108)).
Performance reports can be viewed at the following levels. The specific levels available for each
device depend on the device's configuration:
• Device (VSA or Gen3, single node)
• Service Set (Gen3, multi-node)
• Library
• Port
• Drive
Viewing the Performance report 77