HP Data Protector Software Performance White Paper Executive summary....................................................................................................................................... 3 Overview ....................................................................................................................................................... 3 Objectives and target audience ...............................................................................................................
HPCreateData .................................................................................................................................... 20 HPReadData....................................................................................................................................... 22 LoadSim 2003..................................................................................................................................... 22 Test data .......................................................
Executive summary This white paper provides performance-related information for HP Data Protector software 6.0 together with some typical examples. The emphasis is on backup servers and two common backup and restore performance questions: • Why are backups so slow? • Why are restores so slow? The first step towards estimating backup requirements and performance is a complete understanding of the environment. Many performance issues can be traced to hardware or environmental issues.
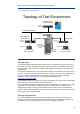
maintain a consistent process and set expectations for data backup and recovery. Often these business expectations are documented in a Service Level Agreement (SLA). HP has conducted testing in typical solution configurations for backup and recovery.
Figure 1 illustrates the topology layout of the test environment. Figure 1.
LAN infrastructure The LAN consisted of one HP ProCurve switch with 20 x 10/100/1000-ports. All network links were configured with1 Gb. SAN infrastructure The fabric consisted of one HP ProCurve SAN switch 4/16. All links between servers and storage devices were 4 Gb. The HP-UX and Windows server were equipped with one dual-channel Host Bus Adapter (HBA) each, and connected to the SAN switch for optimal performance.
Backup environment The backup manager is the core of any backup environment that you should check for requirements and compatibility. Please check at http://www.hp.com/go/dataprotector the following documents: • HP Data Protector Concepts Guide • HP Data Protector Installation and Licensing Guide • HP Data Protector Product Announcements, Software Notes, and References • Data Protector support matrices Note: Please check the Data Protector support matrices carefully and install the latest patches.
Figure 2. Data Protector architecture Cell Manager The Cell Manager is the main system that controls the Data Protector cell from a central point, where the Data Protector core software with the Internal Database (IDB) is installed. The Cell Manager runs Session Managers that control backup and restore sessions and write session information to the IDB. The IDB keeps track of the backed-up files as well as of the configuration of the Data Protector cell.
data with the Disk Agent. A backup device can be connected to any system and not only to the Cell Manager. Client systems with backup devices are also called Backup Servers.
Backup and restore designs Backup environments can be designed using a variety of configurations. The following sections describe three designs typically used in backup and restore solutions. Direct attached storage (DAS) Direct attached storage (see Figure 3) implies that the storage you are backing up to and restoring from is directly attached to the server through a SCSI or Fibre Channel bus.
Local area network (LAN) When combined with a server that has a DAS design, this solution allows servers and clients to back up and restore over the LAN to the machine with the DAS tape library or disk array (see Figure 4). Nowadays, this is the standard method that is employed throughout most data centers. It allows backup devices to be shared by other servers on the network. However all backup data must be passed over the public LAN, or a dedicated backup LAN, which can reduce the overall performance.
Storage Area Network (SAN) SAN solutions (see Figure 5) are very similar to DAS solutions. However, the storage on the SAN may be shared between multiple servers. This shared storage can be both disk arrays and tape libraries. To the server it will appear as if it owns the storage device, but the shared Fibre Channel bus and the controllers for the disk and tape devices allow the devices to be shared. This configuration is very advantageous for both resource sharing and performance. Figure 5.
Backup performance Backup performance will always be limited by one or more bottlenecks in the system, of which the tape drive is just one part. The flow of data throughout the system must be fast enough to provide the tape drive with data at its desired rates. High-speed tape drives, such as the HP StorageWorks Ultrium 960 tape drive, are so fast that making them the bottleneck can be very challenging. All components must be considered and analyzed for getting the best backup performance.
During backup, these servers should not be under heavy load from other applications that run I/O and CPU intensive operations, such as virus scans or a large number of database transactions. Backup servers demand special attention for proper sizing because they are central to the backup process as they run the required agents. The data is passed into and out of the server’s main memory as it is read from the disk subsystem or network and written to tape.
RAID The use of RAID for a disk backup should be carefully considered. There are five main levels of RAID each with their own strengths. The raw I/O speed of the disk backup device significantly affects the overall backup performance. There are five main levels of RAID that are commonly referred to: • RAID 0 (Striping) Data is striped across the available disks, using at least two disk drives. This method offers increased performance, but there is no protection against disk failure.
• SAN switch (total and single port bandwidth) • Cabling (each cable type has unique performance and distance specifications) 16
Finding bottlenecks Process for identifying bottlenecks In order to get the maximum performance of a backup and restore environment, it is important to understand that many elements influence backup and restore throughput. A process is needed that breaks down a complex SAN infrastructure into simple parts, which can be analyzed, measured, and compared. The results can then be used to plan a backup strategy that maximizes performance.
• HPCreateData • HPReadData • LoadSim 2003 HP StorageWorks Library and Tape Tools diagnostics (L&TT) HP’s industry-leading Library and Tape Tools diagnostics assist in troubleshooting backup and restore issues in the overall system. They include tools to help identify where bottlenecks exist in a system, and valuable tools for HP tape drive performance and diagnostics needs. The Windows version of L&TT uses a graphical user interface (GUI) as shown in Figure 8.
The features of L&TT can be seen in the Tape Drive Performance GUI as shown in Figure 9. The embedded tools behind it are HPCreateData and HPReadData. Figure 9. Library and Tape Tools Diagnostics GUI – Tape Drive Performance L&TT can be downloaded free from http://www.hp.com/support/tapetools.
HPCreateData The HPCreateData PAT utility is a file system generator for measuring restore performance. It is useful in assessing the rate at which your disk subsystem can write data, which is ultimately what will limit the restore performance. To write more than one stream, initiate multiple instances of HPCreateData. HPCreateData version 1.2.3 was used for testing. Figure 10 shows an example for creating Windows test data. Figure 10.
Executing HPCreateData results in a directory and file structure similar to that shown in Figure 11. In each directory, 750 files were created with a depth of 5 and breadth of 6. Figure 11. Executing HPCreateData for Windows – directory and file structure HPCreateData can be downloaded free from http://www.hp.com/support/pat.
HPReadData The HPReadData PAT utility is useful in assessing the rate at which your disk subsystem can supply data, which is ultimately what will limit backup performance. It simulates the way Data Protector reads files. A single instance of HPReadData can read eight streams simultaneously from your array. To read more than eight streams, initiate multiple instances of HPReadData. HPReadData is available for Windows, HP-UX, Solaris, and Linux. HPReadData version 1.2.4 was used for testing.
Figure 13 shows the initial screen of LoadSim 2003. Figure 13. LoadSim 2003 – initial screen LoadSim provides many configuration parameters for simulating Microsoft Exchange Server environments. If 500 users are initialized with the default initialization values for either the MMB3, Heavy, or Cached Mode profile, the Exchange database will grow to approximately 54 GB. Figure 14 illustrates the default LoadSim configuration parameters for distribution lists. Figure 14.
Test data In the following proof points, two different types of file systems and one Microsoft Exchange Server 2003 were created, so that the results shown are realistically achievable in similar situations: 1. Typical file server data with fewer files and a broad range of size (KB/MB) 2. Problematic file server data with millions of small files 3. Typical Microsoft Exchange Server 2003 data Data creation tools All test data was created using the following public tools: • HP L&TT version 4.
Figure 15 illustrates an example of an Exchange Server that is configured for LoadSim testing. In this example, the Exchange System Manager was used to add three additional storage groups named StorageGroup1 – StorageGroup3. Also, one mailbox store was added to each storage group. These mailbox stores were named Store1 – Store4. Figure 15. Exchange System Manager with additional storage groups and additional mailbox stores Two LoadSim features were used with their default initialization parameters: 1.
Creating typical files for Windows NTFS The typical file system was created with file sizes between 64 KB and 64 MB and the compressibility of the data 2:1. The utility created an equal distribution of files in each directory. Figure 16 shows the HPCreateData input parameters and results. Figure 16. HPCreateData for Windows – creating typical files Finally, the file system contained 49.85 GB with 4,389 files in 20 folders.
Creating typical files for HP-UX VxFS The typical file system for HP-UX VxFS was created with file sizes between 64 KB and 64 MB and the compressibility of the data 2:1. The utility created an equal distribution of files in each directory. Figure 17 illustrates the L&TT input parameters and Figure 18 the results. Figure 17. Library and Tape Tools Diagnostics for HP-UX – creating typical files – input parameters Figure 18.
Creating millions of small files for Windows NTFS The file system with millions of small files for Windows NTFS was created with file sizes between 4 KB and 16 KB and the compressibility of the data 2:1. The utility created an equal distribution of files in each directory. Figure 19 illustrates the HPCreateData input parameters and results. Figure 19. HPCreateData for Windows – creating small files Finally, the file system contained 49.27 GB with 5,535,750 files in 7,380 folders.
Creating millions of small files for HP-UX VxFS The file system with millions of small files for HP-UX VxFS was created in a similar manner to Windows. The file sizes were between 4 KB and 16 KB and the compressibility of the data 2:1. The utility created an equal distribution of files in each directory. Note: The number of files per directory was set to 120 due to limitations of L&TT version 4.2 SR1a.
Creating data for Microsoft Exchange Server 2003 LoadSim was configured for simulating 2,000 users. Four equal storage groups were created with one store each as illustrated in Figure 22. Figure 22. LoadSim Topology for simulating 2,000 users The LoadSim initialization resulted in four storage groups with one 50 GB database each. The total size, which is relevant for backups and restores, was 200 GB.
Evaluating tape and disk drive performance The performance test of tape and disk drives gives a good overview of what the source and target devices are able to provide. Backup applications cannot perform better than these basic tools. Tape write and read performance The tape drive performance was determined with the HP StorageWorks Library and Tape Tools Diagnostics (L&TT).
Figure 24. Library and Tape Tools Diagnostics for Windows – test results L&TT for HP-UX was configured for writing and reading with the following parameters: • 4.3:1 compressible data with 128 KB block size, 32768 repeats and 8 blocks • 2:1 compressible data with 128 KB block size, 32768 repeats and 8 blocks Note: L&TT for HP-UX does not offer zero patterns. Therefore, the highest available compression pattern of 4.3:1 was specified.
Figure 26.
The results of all L&TT tape drive tests are illustrated in Figure 27, which shows the performance limits of a direct attached Ultrium 960 tape drive. This figure is a reference for any later Data Protector test. The tape drive cannot be faster as with L&TT. This applies to any backup application. Figure 27. Library and Tape Tools – results of tape drive tests Basic Tape Drive Tests HP Storage Works Library and Tape Tools Windows 200 180 176 HP-UX 188 180 160 154 156 Tape Write Comp.
Disk write performance The disk write performance was determined with L&TT for HP-UX and with the HPCreateData utility for Windows. Note: The performance data of parallel writes is determined by the data volume divided by the time of the slowest write process. This approach simulates a backup application that does not finish until the last byte is written.
Disk read performance The disk read performance was determined for HP-UX with L&TT, and for Windows with the HPReadData utility. Figure 29 demonstrates that multiple reads (five streams from five disk volumes) perform much better than single reads (one stream from one disk volume). With Windows, single reads of small files (4 – 16 KB) are very slow because the NTFS file system overhead is much higher than with HP-UX VxFS. Figure 29.
Evaluating Data Protector performance This section highlights Data Protector performance, and uses the results of the previous sections for finding the bottleneck and giving recommendations. The procedures of this section should be transferable to many customer environments.
HP StorageWorks Ultrium 960 tape drive configuration For all tests with the Ultrium 960 tape drive, the block size was configured in Data Protector with 256 KB (64 KB default) as shown in Figure 30. See Getting the most performance from your HP StorageWorks Ultrium 960 tape drive white paper (downloadable from http://h18006.www1.hp.com/storage/tapewhitepapers.html) for further details. Figure 30.
the first tree walk of UNIX file systems is disabled and POSIX hard links are backed up as files. Figure 31 illustrates the correct configuration for disabling the tree walk. Figure 31. Disabling the first tree walk for UNIX file systems – Backup POSIX hard links as files Data Protector IDB considerations Note: The IDB logging level was not changed from its default value of “Log All”. This logging level is the worst case for the IDB while each file is tracked.
Backup of typical and small files This section covers the local and network backup of typical and small files. For Windows NTFS file systems with millions of small files, the first tree walk was disabled as described in the section File System Tree Walk on page 38. For UNIX file systems, the first tree walk was always enabled (default) because it is less critical. Figure 32 illustrates the effect of the first file system tree walk during the HP-UX network backup of small files.
Local backup of typical files The typical files were saved to the SCSI-attached Ultrium 960 tape drive. For Windows, test 1 in Table 1 shows that that the tape device wrote at 154.00 MB/s. This was sufficient for backing up a single file system as shown in test 2 with 105.25 MB/s. But when backing up multiple file systems, as shown in test 3, the file systems were able to provide 262.24 MB/s, which was faster than the Ultrium 960 tape drive. Test 5 showed that the Data Protector performance of 151.
Local backup of small files The small files were saved to the SCSI-attached Ultrium 960 tape drive. Table 2 shows that file systems with millions of small files were not able to fully use the Ultrium 960 tape drive. The file systems were the bottleneck for both operating systems. This also had some impact on Data Protector because the large amount of file information that had to be written to tape and into Data Protector’s IDB resulted in an additional performance loss of 6.
Network backup of typical files The typical files were saved from the client server via the network (Gigabit Ethernet) to the remote backup server and its SCSI-attached Ultrium 960 tape drive. Table 3 shows that the tape device in test 1 and the disk device in test 3 were faster than Data Protector in Tests 4 and 5. In this scenario, both operating systems showed the same backup performance via network, which was the bottleneck.
Network backup of small files The small files were saved via the network (Gigabit Ethernet) to the remote backup server and its SCSI-attached Ultrium 960 tape drive. Table 4 shows that file systems with millions of small files were not able to fully use the remote Ultrium 960 tape drive with the network (Gigabit Ethernet) limit of 120 MB/s. The file systems were the bottleneck for both operating systems.
Restore of typical and small files This section covers local and network-based restore of typical and small files. Local restore of typical files The files were restored directly from the SCSI-attached Ultrium 960 tape drive. For Windows, test 1 in Table 5 shows that the tape device did not read faster than 156.00 MB/s. Test 3 shows that the disk device resulted in164.67 MB/s write performance and test 4 in 145.07 MB/s restore performance for Data Protector.
Local restore of small files The files were restored directly from the SCSI-attached Ultrium 960 tape drive. For Windows, test 1 in Table 6 shows that the tape device did not read faster than 156.00 MB/s. Test 2 shows that the disk device resulted in 19.94 MB/s single write performance. Test 3, with Data Protector, resulted in just 3.38 MB/s single restore performance. Here, the bottleneck was the file system which was very busy during the recovery.
Network restore of typical files The typical files were restored via the network (Gigabit Ethernet) from the remote backup server and its SCSI-attached Ultrium 960 tape drive. Table 7 shows that the tape device of test 1 and the disk device of test 3 were faster than with Data Protector in test 4. In this scenario, both operating systems showed the same performance for the tests via the network, which was the bottleneck.
Network restore of small files The small files were restored via the network (Gigabit Ethernet) from the remote backup server and its SCSI-attached Ultrium 960 tape drive. For Windows, Table 8 shows that the tape device did not read faster than 156.00 MB/s, and test 2 shows that the disk device can write with 19.94 MB/s. But test 3 resulted in just 3.66 MB/s restore performance for Data Protector. The bottleneck was the file system, which was very busy during the recovery.
tape drive can handle (154 MB/s). The Exchange Server backup of test 4 (138.70 MB/s) did not completely reach the Ultrium tape drive performance of test 1 (154 MB/s). This is because the data was not always streamed with the same performance. The performance ups were higher, and if the database was switched (one database backup had finished and the next one started), the downs much lower. Table 9. Local backup of Exchange Server 2003 – bottleneck determination Test 1.
the backup session. If you selected the load balancing option in the Create New Backup dialog (the default), it cannot be deselected. Figure 33 illustrates a backup configuration with the default load balancing switched ON. Figure 33. Backup configuration – load balancing If load balancing was not selected (OFF) in the Create New Backup dialog, you can choose single devices to be used for each object in a backup specification.
Figure 34 shows the default configuration parameters for file systems. The software compression is set to OFF by default. Figure 34.
Figure 35 demonstrates how performance efficient the Ultrium 960 tape drive compression is. With the software compression disabled (default), the backup performance was 156 MB/s. With the software compression enabled, the performance was just 46 MB/s. Figure 35.
Figure 36 shows that enabling software compression increased the CPU load from 13% to 99%. The CPU load was very high because Data Protector compressed five file systems in parallel. Figure 36.
Figure 37 shows the different ratios for software and hardware compression. HP-UX gzip (GNU zip) was additionally tested because it is the current standard compression utility for UNIX and a good indicator for possible ratios. The compression ratio of HP-UX gzip resulted in 59%, the Ultrium 960 built-in compression in 50% and Data Protector software compression in 45%. Figure 37. Compression ratios for HP-UX Compression Ratios for Typical Files (2:1) 100.0% 90.0% Compression Ratio 80.0% 70.0% 59% 60.
Figure 38 shows the default configuration parameters for file systems. The logging level is set to Log All. Figure 38. Backup Configuration – default file system options – logging level Log Files Detect Windows NTFS hardlinks This option enables detection of NTFS hard links. By default, Data Protector does not detect NTFS hard links, and backs them up as files. This significantly improves backup performance, but the files occupy more space on the media.
Figure 39 shows the default configuration parameters for Windows file systems. The NTFS hardlinks detection is OFF. Figure 39. Backup configuration – advanced WinFS filesystem options – detect NTFS hardlinks Use native Change Log Provider This option was introduced with Data Protector 6.1. If selected, enhanced incremental backup will be performed using the Change Log Provider (if it is available).
Figure 40 shows the default configuration parameters for filesystems. Use of the native Filesystem Change Log Provider is set OFF. Figure 40. Backup configuration – default filesystem options – use Change Log Provider A file tree walk can take a considerable amount of time, especially when the directory structure is large and contains millions of files.
Figure 41 demonstrates how efficiently the File System Change Log Provider option performs. Best results can be achieved if file systems have few changes, like in this chart shown with 1% incremental backup. Figure 41. Dependencies of Change Log Provider and Enhanced Incremental Database (EIDB) Updating the Enhanced Incremental Database (EIDB) has a large performance impact.
Figure 42 demonstrates the different runtimes if the EIDB is updated or not. The Windows NTFS file system was initially loaded with 1 million small files. Figure 42. Dependencies of Change Log Provider and Enhanced Incremental Database (EIDB) Asynchronous reading This option was introduced with Data Protector 6.1 and enables faster reading for data that is striped across multiple physical disks. It applies to disk arrays if their logical drives are configured in striped mode.
Figure 43 shows the default configuration parameters for Windows file systems. The asynchronous reading is set OFF. Figure 43. Backup configuration – advanced WinFS filesystem options – asynchronous reading On the client, the Data Protector template Data_Protector_home\omnirc keeps parameters for asynchronous reading: OB2DAASYNC=not set|0|1 (default: not set) If set to one, the Disk Agent will always use asynchronous reading. If set to zero, the Disk Agent will never use asynchronous reading.
Figure 44 shows how backup server disks were reconfigured for testing. One SAS array was created based on four internal 72 GB 15K SAS disks and all space was allocated for a single logical drive in RAID 1+0 mode. Figure 44. Smart array configuration of backup server – one logical drive in RAID 1+0 mode and 4 SAS disks As shown in Table 11, the backup performance of typical files in test 1 (125.42 MB/s) was considerably improved with asynchronous reading enabled (163.09 MB/s).
Figure 45 shows that asynchronous reading resulted in a disk queue length between 18 and 50. Figure 45. Smart array configuration of backup server – one RAID 1+0 logical drive with 4 SAS disks Device and media options You can set advanced options for devices and media when configuring a new device, or when changing device properties. The availability of these options depends on the device type. You can also set some of these options when configuring a backup, for example, the concurrency.
Figure 46 shows the default configuration parameters for Ultrium tape drives. The concurrency is set to four. Note that other tape drives or backup devices could have different values. Figure 46.
Figure 47 illustrates the performance of a local backup to the Ultrium 960 tape drive with different concurrencies. It shows that a Ultrium 960 concurrency value of three was sufficient for this test environment with the SAN-connected disk volumes. The default value of four or the higher value of five did not improve performance but did also not degrade it. Higher values for concurrency are useful for environments with slower disks and file systems. Figure 47.
Figure 48 demonstrates that the CPU load was low during all backup tests. Concurrency values of three to five resulted in the same CPU load. This is similar to the backup performance as shown in Figure 45. Figure 48.
Cyclic redundancy check (CRC) Cyclic redundancy checking (CRC) is an enhanced checksum function. When this option is selected, CRC checksums are written to the media during backup. CRC checks allow you to verify the media after the backup. Data Protector re-calculates the CRC during a restore and compares it to the CRC on the medium. It is also used while verifying and copying the media. This option can be specified for backup, object copy, and object consolidation operations. The default value is OFF.
Figure 50 demonstrates that enabling CRC checking required additional system resources. The CRC ON test resulted in approximately 20% performance decrease. Figure 50. Performance of HP-UX local backup to Ultrium 960 with CRC checking OFF/ON Data Protector CRC Check OFF/ON Performance of HP-UX Local Backup to Ultrium 960 180.00 160.00 156 140.00 124 MB/s 120.00 100.00 80.00 60.00 40.00 20.00 0.
Figure 51 shows that enabling CRC checking required additional CPU resources. The CRC ON test resulted in more than twice the CPU load. Figure 51. CPU load of HP-UX local backup to Ultrium 960 with CRC checking OFF/ON Data Protector CRC Check OFF/ON CPU Load of HP-UX Local Backup to Ultrium 960 100% 90% 80% CPU Load 70% 60% 50% 37% 40% 30% 20% 16% 10% 0% OFF ON CRC Check Block size Segments are not written as whole units, but in smaller subunits called blocks.
stored in data blocks of data segments. Information about each data segment is stored in the corresponding catalog segment. This information is first stored in the Media Agent memory and then written to a catalog segment on the medium as well as to the IDB. All segments are divided by file marks as shown in Figure 53. Figure 53. Data Protector Medium – data segments, catalog segment, header segment, and file marks Segment size, measured in megabytes, is the maximum size of data segments.
Figures 54 and 55 illustrate the results of backups with different segment sizes. Larger segment sizes improved the backup performance, but resulted in some additional CPU load. Figure 54 Performance of HP-UX local backup to Ultrium 960 with segment sizes 10 – 10,000 MB Segment Size 10 - 10.
Figure 55. CPU load of HP-UX local backup to Ultrium 960 with segment sizes 10 – 10,000 MB Segment Size 10 - 10.000 MB CPU Load of HP-UX Local Backup to Ultrium 960 100% 90% 80% CPU Load 70% 60% 50% 40% 30% 20% 10% 0% 16% 17% 17% 100 1,000 10,000 3% 10 Segment Size (MB) Note: Larger segments sizes improve the backup performance but could have negative impact on restore performance. Data blocks are found faster if restored from a backup with smaller segment sizes.
Figure 56. Performance of HP-UX local backup to Ultrium 960 with 1 – 32 Disk Agent buffers Data Protector Disk Agent Buffers 1 - 32 Performance of HP-UX Local Backup to Ultrium 960 180 160 158 156 1 8 160 160 161 16 24 32 140 MB/s 120 100 80 60 40 20 0 Disk Agent Buffers Figure 57.
Hardware compression Most modern backup devices provide built-in hardware compression that can be enabled by selecting the appropriate device file or SCSI address in the device configuration procedure. Hardware compression increases the speed at which a tape drive can receive data, because less data is written to the tape. Recommendations: 1. Do not use software and hardware compression at the same time because double compression decreases performance without giving better compression results. 2.
Tuning Data Protector performance for Microsoft Exchange Server 2003 Data Protector’s backup and restore performance for Microsoft Exchange Server 2003 can be improved by modifying its configuration parameters for backups. All tests were executed with the NULL device to remove the tape drive as a bottleneck. Figure 60 demonstrates how efficient a higher concurrency value could be. All tests were executed with the same buffer size of 64 KB because this is the minimum value for a concurrency of 4 (4 x 16 KB).
Figure 61 shows that a higher concurrency caused a higher CPU load. However, this slight increase can be disregarded when compared with the remarkable increase of the performance as shown in the previous Figure 60. Figure 61.
Figure 62 demonstrates that different buffer sizes resulted in similar backup performance. The default buffer size of 32 KB (per backup device) was already a good choice. Figure 62. Performance of MS Exchange Server 2003 local backup to Ultrium 960 with buffer size 32 – 1,024 KB MS Exchange Server 2003 Buffer Size 32 - 1,024 KB Performance of Local Backup to Ultrium 960 250.00 227 227 222 224 32 64 128 256 230 227 512 1,024 200.00 MB/s 150.00 100.00 50.00 0.
Figure 63 shows that different buffer sizes resulted in the same CPU load (12%). This was expected because there was only a small performance difference, as shown in Figure 62. Figure 63.
across slow LAN (100 Mb/s) environments. This could provide a better backup performance, but it will also cause high CPU loads on the client server. • When backing up typical files directly to a SCSI-attached Ultrium 960 tape drive, parallel backups (multiplexing/concurrency) are recommended because one single stream cannot fully use the tape drive. Data Protector’s default concurrency is four.
Appendix A. Reference documentation HP documents and links Storage • HP StorageWorks Enterprise Virtual Array configuration best practices ftp://ftp.compaq.com/pub/products/storageworks/whitepapers/5982-9140EN.pdf • HP StorageWorks SAN Design Reference Guide http://h18000.www1.hp.com/products/storageworks/san/documentation.html Backup • Enterprise Backup Solution (EBS) Design Guide and compatibility matrix http://www.hp.
Glossary cell A set of systems that are under the control of a Cell Manager. The cell typically represents the systems on a site or an organizational entity, which are connected to the same LAN. Cell Manager The main system in the cell where the essential software of Data Protector is installed and from which all backup and restore activities are managed. CSI (Command Screen Interface) A non-graphical user interface which is based on a menu structure.
SPOF (Single Point of Failure) Any part of the system that can, if it fails, cause an interruption of required service. This can be as simple as a process failure or as catastrophic as a computer system crash.
For more information • HP Data Protector software http://www.hp.com/go/dataprotector • HP HP9000 and ProLiant servers http://h18000.www1.hp.com/products/servers • HP StorageWorks Ultrium tape drives http://h18006.www1.hp.com/storage/tapestorage/ultriumdrives.html • HP StorageWorks Enterprise Virtual Arrays (EVA) http://h18006.www1.hp.com/products/storageworks/eva • Enterprise Backup Solution (EBS) http://www.hp.com/go/ebs • Microsoft Exchange Server http://www.microsoft.