
HP StorageWorks Clustered File System 3.6.0 Windows Storage Server Edition Administration Guide (403103-005, January 2008)


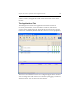
Table Of Contents
- Contents
- HP Technical Support
- Quick Start Checklist
- Introduction to HP Clustered File System
- Cluster Administration
- Administrative Considerations and Restrictions
- Tested Configuration Limits
- Volume and Filesystem Limits
- User Authentication
- Start the Management Console
- Cluster Management Applications
- The HP CFS Management Console
- View Installed Software
- Start HP Clustered File System
- Stop HP Clustered File System
- Back Up and Restore the Cluster Configuration
- HP Clustered File System Network Port Numbers
- Configure Servers
- Configure Network Interfaces
- Configure the SAN
- Configure Dynamic Volumes
- Configure PSFS Filesystems
- Manage Disk Quotas
- Manage Hardware Snapshots
- Configure Security Features
- Configure Event Notifiers and View Events
- Overview
- Install and Configure the Microsoft SNMP Service
- Cluster Event Viewer
- Configure Event Notifier Services
- Select Events for a Notifier Service
- Configure the SNMP Notifier Service
- Configure the Email Notifier Service
- Configure the Script Notifier Service
- View Configurations from the Command Line
- Test Notifier Services
- Enable or Disable a Notifier Service
- Restore Notifier Event Settings to Default Values
- Import or Export the Notifier Event Settings
- Using Custom Notifier Scripts
- Cluster Operations on the Applications Tab
- Configure Virtual Hosts
- Configure Service Monitors
- Configure Device Monitors
- Advanced Monitor Topics
- SAN Maintenance
- Other Cluster Maintenance
- Management Console Icons
- Index

Chapter 14: Cluster Operations on the Applications Tab 169
The cells indicate whether a resource is deployed on a particular server,
as well as the current status of the resource. If a cell is empty, the resource
is not deployed on that server.
The icons used on the Applications tab report the status of the servers,
applications, and resources. The following icons are used in the server
columns to indicate the status of applications and resources. Servers also
use these icons when they are in a state other than Up/Okay.
Virtual hosts and single-active monitors use the following icons to
indicate the primary and backups. Multi-active monitors use the same
icons but do not include the primary or backup indication. The green
arrow changes as shown above when the status of the virtual host or
monitor changes. The green dot changes color as the status changes.
Application States
The Application tab provides a summary of the state of the applications
and allows you to quickly drill-down within an application to locate
resources that are down or experiencing problems.
The application icon and its corresponding status indicate the state of the
least healthy resource in the application. If OK appears in the status
column, all clients can access the application. If the status is Error or
Warning, at least one resource in the application has that status.
Up/Okay
Starting
Stopping
Down
Unknown