
HP StorageWorks Clustered File System 3.6.0 Windows Storage Server Edition Administration Guide (403103-005, January 2008)
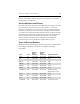
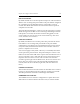
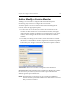
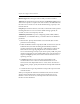
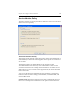
Table Of Contents
- Contents
- HP Technical Support
- Quick Start Checklist
- Introduction to HP Clustered File System
- Cluster Administration
- Administrative Considerations and Restrictions
- Tested Configuration Limits
- Volume and Filesystem Limits
- User Authentication
- Start the Management Console
- Cluster Management Applications
- The HP CFS Management Console
- View Installed Software
- Start HP Clustered File System
- Stop HP Clustered File System
- Back Up and Restore the Cluster Configuration
- HP Clustered File System Network Port Numbers
- Configure Servers
- Configure Network Interfaces
- Configure the SAN
- Configure Dynamic Volumes
- Configure PSFS Filesystems
- Manage Disk Quotas
- Manage Hardware Snapshots
- Configure Security Features
- Configure Event Notifiers and View Events
- Overview
- Install and Configure the Microsoft SNMP Service
- Cluster Event Viewer
- Configure Event Notifier Services
- Select Events for a Notifier Service
- Configure the SNMP Notifier Service
- Configure the Email Notifier Service
- Configure the Script Notifier Service
- View Configurations from the Command Line
- Test Notifier Services
- Enable or Disable a Notifier Service
- Restore Notifier Event Settings to Default Values
- Import or Export the Notifier Event Settings
- Using Custom Notifier Scripts
- Cluster Operations on the Applications Tab
- Configure Virtual Hosts
- Configure Service Monitors
- Configure Device Monitors
- Advanced Monitor Topics
- SAN Maintenance
- Other Cluster Maintenance
- Management Console Icons
- Index

Chapter 16: Configure Service Monitors 197
Monitor Type: Select the type of service that you want to monitor.
Timeout: The maximum amount of time that the monitor_agent process
will wait for a probe to complete. For most monitors, the default timeout
interval is five seconds. You can use the default setting or specify a new
timeout interval.
Frequency: The interval of time, in seconds, at which the monitor probes
the designated service. You can use the default setting, typically 30
seconds, or enter a new frequency interval.
Additional parameters: If you are configuring a DNS, HTTP, HTTPS,
NTSERVICE, or CUSTOM monitor, you will be asked for an additional
parameter.
• DNS monitor. Specify the IP address to be resolved. (The monitor
performs reverse lookup.)
• HTTP and HTTPS monitors. Specify the URL for the service. (For the
HTTPS monitor, the URL should begin with HTTPS.) When the
monitor performs its probe operation, it will attempt to retrieve the
URL from the server, giving a higher level of assurance that the
service is functioning correctly. If you do not specify a URL, the probe
operation will connect to the standard Web server port and wait for a
response. If httpd responds, the monitor assumes that the service is
operating correctly.
• NTSERVICE monitor. If you want services dependent on the
monitored NT service to also be started when the NT service is
started, click “Start dependent services.” Then, at the “Start Service
Retry Count” prompt, specify the number of attempts that should be
made.
•
CUSTOM monitor. Type the pathname for the probe script to be used
with the monitor.
When you complete the Add Service Monitor form, the new monitor
appears on the Management Console. In this example, the service
monitor is active on server owl, which provides the active network
interface for the virtual host.