
HP Traffic Director Server Appliances sa7200/sa7220 and 8200/sa8220 - User Guide

C H A P T E R 4 HP Traffic Director Server Appliances User Guide
128
Statistics Screen
The SA8220 provides a screen where you can view four different
statistical categories, in a variety of graphical display formats, at the
levels of Device, Service, and Server. Statistical data series are
defined in the main Screen, and subsequently displayed in a separate
window.
The four statistical categories for SA8220s are listed below:
• Average Connections per Second
• CPU Utilization
• Open Connections
• The SA8220’s Uptime
For services and servers, the available statistics are listed below:
• Average Response Time (ms)
• Average Connections per Second
NOTE: Statistics for
open connections in
RICH mode (on the
SA8220 and the SA7220)
are not available.
• Open Connections
• Service or Server Uptime
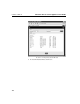
To display the Statistics screen:
1. In the Topology screen's toolbar, click the Statistics icon.
Statistics
Screen
Controls
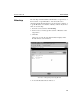
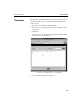
The Statistics Screen (shown below) is divided into the four sections
or functional areas below:
• Statistics Box
• Graph Options
• Selection List
• Window Options
• Selection buttons (the arrows between the Statistics Box and the
Selection List). These are for selecting statistical categories to be
displayed.
• Graph button to launch the graph display window.