
HP e-Commerce / XML director server appliance sa8250 - Users Guide

C H A P T E R 4 Statistics Screen
149
NOTE: Statistics for
open connections in
RICH mode are not
available.
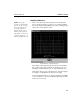
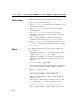
• Available Statistics: In this graphical display, you can specify
which of the available statistics you want to view. These include
Average Response Time, Average Connections per Second, CPU
Utilization, Open Connections, and Uptime. The available
statistics will depend on your selection from the Type pull-down
list. You can select multiple items in this list.
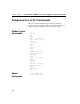
Graph Options
The Graph Options box contains two controls:
• Style: This drop down list specifies the style of the graph used to
display the selected statistics for this data series. Available styles
are Plot, Scatter Plot, Bar, Stacking Bar, Area, and Stacking
Area. The style selected in this list applies to each statistical
category at the time it is selected with the right arrow button as
described above.
• Legend: After the Legend check box is selected, a legend
displays at the bottom of the Graph window for this data series.
This legend identifies each selected statistical category by color
and symbol as it displays on the graph. When disabled, the
legend does not display and the graph display expands to fill the
legend area. It is enabled by default.
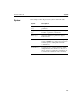
To define a statistical data series, follow these steps:
1. Click the type of item whose statistics you want to display
(System, Server, Service).
2. Click the specific item(s).
3. Click the desired statistic.
4. Click the graph type (Plot, Scatter Plot, Bar, etc.).
5. Click the right arrow selection button to the right of the Statistics
box.
6. Verify that your selections display in the Selection list (to the
right of the Statistics box).
7. Repeat steps (1) through (6) above to graph more statistics, if
needed.