
HP e-Commerce / XML director server appliance sa8250 - Users Guide

C H A P T E R 4 Statistics Screen
151
Graphing Statistics
NOTE: The graph
parameters, including the
Legend checkbox, can be
changed on the fly, but
the results will not be
displayed in the graph
window (in the figure at
right) until you stop and
restart the graph process
from the Statistics Screen.
1. After you’ve entered the desired parameters into the Statistics
Screen, display the graph (or graphs, if you’ve defined multiple
data series and have enabled Multiple Graphs) by clicking Graph
at the bottom of the Statistics Screen.
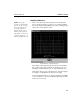
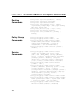
Graph Window with Bar Display
The meaning of the graph depends upon the items and statistics
that you have selected. For example, the graph above shows a
bar display of CPU Utilization for one system (SA8250) only.
Although the image is grey scaled in this text, each plot displays
in a unique color identified at the bottom of the graph.
You can use this information to compare performance of multiple
servers in relation to a service and adjust the Max Response Time
for the servers if needed.