
hp toptools for desktops agent, resource monitoring and performance advisor


2
To enable management of non-HP devices on
your LAN using Toptools Device Manager, the
non-HP PCs must run one or more of the
management protocols SNMP, DMI 2.x, WMI or
HTTP. The corresponding Agents must be
obtained from the respective manufacturer.
For more effective management of non-HP
devices, the HP Toptools Value Pack adds
features for all devices including a System
Performance Advisor, and SNMP trap reception
for non-HP systems with loaded MIBs.
For further details, plus version information and
availability of these software elements, see the
‘More Information’ section at the end of this
Application Note.
Event Alerts
Event alerts are generated when certain pre-
defined thresholds are exceeded, eliminating
the need for constant visual monitoring.
Two levels of alert can be generated:
•
Warning – this means that the situation has
not yet reached critical level but the first
threshold has been exceeded, so a warning is
issued.
•
Critical – this is the most serious alarm and it
indicates that the level has become critical.
You can change these thresholds directly on the
resource monitoring screen in the Toptools Device
Manager.
Sampling Intervals
When monitoring resources, Toptools takes
measurements in two different ways. The first, the
simpler of the two, is a single measurement at an
instant in time. For example, the amount of free
disk space at a particular time.
The second type of measurement is taken over a
fixed period of time, and reflects the average value
during that time. For example, CPU usage and
LAN bandwidth. This type of measurement is
useful when a resource, during normal use, is
subject to dramatic peaks and troughs over a short
period of time. In this case, an average value is a
better reflection of resource utilization, and it
avoids the false alerts that would be produced
when resource utilization suddenly peaks for a
short period.
To get the average value, Toptools takes regular
measurements in very short time intervals, for
example, every 5 to 30 seconds.
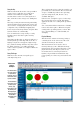
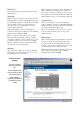
This shows the monitoring of hard
disk drives on a single remote
Vectra PC.
The PC has two logical hard disk
drives, C and D. For each, disk
usage (over a time period) and the
current amount of free disk space
is shown.
You can disable or enable both
monitoring and event alerts on
each disk drive.
To change threshold values, simply
drag the red or yellow arrow up or
down, as desired.
Resource Monitoring
Exampl
e 1