H Broadband Service Analyzer User’s Guide
Copyright Notice Warranty Trademarks/ Acknowledgments Printing history © Hewlett Packard Australia1996 All rights reserved. The information contained in this document is subject to change without notice. HEWLETT-PACKARD MAKES NO WARRANTY OF ANY KIND WITH REGARD TO THIS MATERIAL, INCLUDING, BUT NOT LIMITED TO, THE IMPLIED WARRANTIES OF MERCHANTABILITY AND FITNESS FOR A PARTICULAR PURPOSE.
Certification For product warranties requiring return to HP, this product must be returned to a Hewlett Packard Australia Limited certifies service facility designated by HP. Buyer that this product met its published specifishall prepay shipping charges to HP (and cations at the time of shipment from the shall pay all duties and taxes) for products factory. Hewlett-Packard (HP) further certireturned to HP for warranty service.
Warnings DO NOT operate damaged equipment Whenever it is possible that The following general safety precauthe safety protection features built into this tions must be observed during all product have been impaired, either through phases of operation, service, and physical damage, excessive moisture, or repair of this product.
Avertissement Service et ajustement Cet appareil répond aux normes de la “Classe de sécurité 1” et est muni d’un fil de mise à la terre pour votre protection. Des “tensions dangereuses” résident dans cet appareil. Par conséquent, le service et l’ajustement doivent être effectué uniquement par une personne qualifiée. Pour prévenir les risques de choc électrique, la broche de mise à la terre du cordon d’alimentation ne doit pas être désactivée.
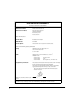
DECLARATION OF CONFORMITY According to ISO/IEC Guide 22 and EN 45014 Manufacturer’s Name Hewlett Packard Australia Ltd. Manufacturer’s Address Australian Telecom Operation 347 Burwood Highway Burwood East, 3151 Victoria, Australia declares that the product: Product Name Broadband Service Analyzer Model Number HP E5200A Product Options This declaration covers all options of the above product. conforms to the following product specifications: Safety EN 61010-1:1993 / IEC 1010-1:1990 + A1 CSA C22.
What is the HP Broadband Service Analyzer? What is the HP Broadband Service Analyzer? The HP E5200A Broadband Service Analyzer is a portable yet powerful tool designed specifically to test broadband equipment, networks, and services. It can be used by public and private network providers to • • • • test network equipment aid in equipment installation test interworking devices test end-to-end services You can use the analyzer to test the physical, ATM, and AAL layers in network traffic.
Where to Find Information Where to Find Information The HP E5200A Broadband Service Analyzer comes with a comprehensive set of paper and online documentation. Use the following table to determine which documents you should use.
Where to Find Information What is it? What does it do? Who is it for? User’s Guide Chapter 5 “Standards and Specifications” lists the electrical, mechanical, and environmental specifications users who are responsible for connecting the analyzer to other equipment Online Help three help volumes— User, Macro, and UPE Compatibility—contain information about, and instructions for using, the analyzer all users Quick Reference provides a brief overview of the analyzer’s main features and functions all
Where to Find Information The release 1.7 documentation, in PDF format, is included on the CD ROM that contains the distribution software. This includes the Release 1.7 Broadband Network Analyzer User’s Guide. The files are in the manuals directory on the CD ROM. This directory contains the following files. File 5200ug31.pdf 5120ig1a.pdf 5121ig1a.pdf 5122ig1a.pdf 5123ig1a.pdf 5125ig1.pdf 5126ig1.
Contents What is the HP Broadband Service Analyzer? ........................................... Where to Find Information ......................................................................... Appendixes ............................................................................................. vii viii xi 1 Setting Up the Analyzer Introduction ................................................................................................. To Unpack the Analyzer .....................................
To Configure the Analyzer and Ports .................................................. 2-18 To Configure the Analyzer ............................................................... 2-18 To Configure a Port .......................................................................... 2-18 To Monitor the Link (Network) ........................................................... 2-20 Link Summary .................................................................................. 2-21 Channel Summary .............
To Upgrade the Analyzer Software ............................................................ 4-10 To Upgrade Software Using Diskettes ................................................... 4-11 To Upgrade Software Using FTP ........................................................... 4-12 5 Standards and Specifications Standards ..................................................................................................... Electrical Specifications .......................................................
xiv
1 Setting Up the Analyzer 1 Setting Up the Analyzer Introduction 1-2 To Unpack the Analyzer 1-3 To Connect the Analyzer to a Computer 1-6 To Connect a Printer to the Analyzer 1-21 To Switch the Analyzer On and Off 1-22 To Back Up and Restore Files 1-23 To Insert or Remove an Interface Pod 1-28 To Troubleshoot the Analyzer 1-30
Setting Up the Analyzer Introduction Introduction When you receive your HP Broadband Service Analyzer, you must perform the following steps before you can use it: • • • • • 1-2 Unpack the analyzer. Connect the analyzer to a controlling computer. Switch on the analyzer. Prepare the analyzer for use. Insert the interface pods.
Setting Up the Analyzer To Unpack the Analyzer 1 Setting Up the Analyzer To Unpack the Analyzer When you receive your HP Broadband Service Analyzer, ensure you have received the correct items by checking the contents of the package against the packing list in each box within the packing carton. Caution The external connectors on the analyzer and interface pods are susceptible to electrostatic discharge (ESD).
Setting Up the Analyzer To Unpack the Analyzer Analyzer Software All of the required software is preinstalled. If you have the HP Broadband Service Analyzer (E5200A), the application software is pre-installed on the analyzer.
Setting Up the Analyzer To Unpack the Analyzer Sync In Power LED Access LED BITS UTP (LAN) Sync Out Power LED Access LED BITS Sync In Sync Out UTP AUI Serial DC Out Power On/Off Switch Serial AUI (LAN) DC Out Power Outlet Light emitting diode (LED) that indicates when power is supplied to the analyzer. Light emitting Diode (LED) that indicates when the analyzer is accessing information from a network.
Setting Up the Analyzer To Connect the Analyzer to a Computer To Connect the Analyzer to a Computer The analyzer is designed for both onsite and remote broadband testing applications. The way in which you connect the analyzer to a computer depends on whether you want to perform remote or local testing.
Setting Up the Analyzer To Connect the Analyzer to a Computer For your safety, the power cord supplied with the analyzer has a grounded plug. Always use the power cord with a properly grounded mains power outlet to avoid electrical shock. If you will be converting data captured by the analyzer into HP Broadband Series Test System (BSTS) captured data files, you must install the Data Conversion Utility (p/n E5200-10010).
Setting Up the Analyzer To Connect the Analyzer to a Computer To Connect the Analyzer to a Point-to-Point Ethernet Interface 3 Connect the analyzer to the notebook PC using the PCMCIA LAN cable. 2 Connect the network cable (E5200-64005) to the PCMCIA LAN cable. 1 Connect the crossover cable (E5200-64006) to the network cable (E5200A64005). 4 Connect the AC adapter to the notebook PC. 5 Connect the analyzer to a mains power outlet.
Setting Up the Analyzer To Connect the Analyzer to a Computer 1 Setting Up the Analyzer To Connect the Analyzer to a Point-to-Point Serial Interface 1 Connect the analyzer to the notebook PC’s serial connector. If this cable is not supplied, use cable p/n 24542U. 2 Connect the analyzer to a mains power outlet.
Setting Up the Analyzer To Connect the Analyzer to a Computer To Connect the Analyzer as a Networked System You should connect the analyzer as a networked system when you want to remotely monitor a network. By connecting the analyzer to a networked system, you can use either the supplied notebook PC, or an HP-UX workstation at a remotely controlled monitoring point. To connect the analyzer as a networked system, you need to perform the following steps: 1 Configure the notebook PC or workstation.
Setting Up the Analyzer To Connect the Analyzer to a Computer 1 Setting Up the Analyzer 3 Note down the workstation’s netmask. You will find this information in the /etc/netlinkrc file. 4 Note down your workstation’s default route. You will find this information in the /etc/netlinkrc file.
Setting Up the Analyzer To Connect the Analyzer to a Computer To Connect the Analyzer 1 Connect the analyzer to the LAN using the UTP cable (E5200-64005). 2 Connect the analyzer to a mains power outlet. Note You can also connect the analyzer to a LAN using a Medium Attachment Unit (MAU). An MAU cable is not provided with the analyzer.
Setting Up the Analyzer To Connect the Analyzer to a Computer 1 Setting Up the Analyzer To Test for Network Connectivity If you have connected the analyzer to a workstation, do the following: • Use the UNIX ping command to verify that the analyzer is up and running on your network. The syntax of the ping command may vary from site to site. See your system administrator or the UNIX online man pages for more details.
Setting Up the Analyzer To Connect the Analyzer to a Computer 3 Select “Change Source or Destination” by using the arrow keys to highlight the option; then pressing either Enter or F4. The Change Source or Destination window is displayed. 4 Select “From Tape Device to Local System” as the Update from Source to Destination by using the arrow keys to highlight the option; then pressing either Enter or F4. The From Tape Device to Local System window is displayed.
Setting Up the Analyzer To Connect the Analyzer to a Computer 1 Setting Up the Analyzer 13 To print help topics, set up the current printer for the help viewer using the Printer Setup option in the File menu. For more information see the How to use Help option in the Help menu in the help viewer. To Record the System Administration Information 1 Switch on the analyzer (see “To Switch the Analyzer On and Off” on page 1-22). 2 Log in to the analyzer using the following user name and password.
Setting Up the Analyzer To Connect the Analyzer to a Computer To Connect the Analyzer Using a Modem You can use a modem (configured to no parity, 8 data bits, 1 stop bit) to remotely access the analyzer from the notebook PC. You should use a modem connection only to access the Tcl interface.
Setting Up the Analyzer To Connect the Analyzer to a Computer Note You can either connect the notebook PC’s serial port to an external modem, or you can connect the PCMCIA internal modem directly to the telephone socket. 3 Connect the notebook PC’s serial port to the modem (RS-232C US/Euro modem cable p/n 24542M—part not supplied), or connect the PCMCIA internal modem to the telephone outlet. 1 Connect the analyzer’s serial port to the modem (RS-232C US/Euro modem cable p/n 24542M—part not supplied).
Setting Up the Analyzer To Connect the Analyzer to a Computer To Set up the Modem Connection 1 Double-click the Dialer icon in the Acadia/VxD program group. Dialer The Ipswitch, Inc. SLIP/PPP Configure & Dial window is displayed. 2 Click the phone number (e5200a) in the Phonebook list; then click the Dial button. 3 If required, change the baud rate. To change the baud rate, click the Setup button on the Ipswitch, Inc.
Setting Up the Analyzer To Connect the Analyzer to a Computer 1 Setting Up the Analyzer 3 After you have connected the analyzer, use the system administration functions of the analyzer to set the • system administrator password (see “To Change a Password” on page 4-6) • required users (see User Online Help) • date, time, and time zone (see “To Set the System Date, Time, and Time Zone” on page 4-7) • printer (see User Online Help) • remote hosts (see User Online Help) • routing details (see User Online Hel
Setting Up the Analyzer To Connect the Analyzer to a Computer To Change Configuration Parameters You can change the configuration parameters for the analyzer and the controlling computer using either • the Network Configuration utility. Use this method of changing the configuration parameters when you want to connect the analyzer as a networked system. You must change the configuration parameters before you connect the analyzer. • the analyzer system administration functions.
Setting Up the Analyzer To Connect a Printer to the Analyzer 1 Setting Up the Analyzer To Connect a Printer to the Analyzer You can print from the analyzer if a printer is connected to your computer. The printer must be compatible with PCL 5. If the analyzer is connected to a network, you can also print using a LAN printer (using PCL 5). Refer to the computer’s user’s guide for information on how to connect the printer.
Setting Up the Analyzer To Switch the Analyzer On and Off To Switch the Analyzer On and Off After you connect the analyzer to the computer, you can switch on the equipment. 2 Turn on the power switch. 1 Turn on the computer power switch. The analyzer takes approximately two minutes to run its self-tests and switch on. While it is switching on, the Power LED flashes green, and if the analyzer is booting from a PC or LAN, the Access LED flashes orange.
Setting Up the Analyzer To Back Up and Restore Files 1 Setting Up the Analyzer To Back Up and Restore Files When you use the HP Broadband Service Analyzer, you create files that are stored on the analyzer’s hard disk. You should back up these files • • after you connect and change the configuration of the analyzer on a regular basis to safeguard against data loss See the Acadia/VxD Installation, Overview and Command Reference for more detailed information about how to NFS mount a file system.
Setting Up the Analyzer To Back Up and Restore Files To Back Up Files You should perform regular backups to ensure minimal loss of data if a problem arises with the analyzer’s hard disk. You should back up the analyzer’s hard disk to the controlling computer’s hard disk, then archive the data to backup storage media. The backup storage media may be either diskettes, tape, or a network storage device.
Setting Up the Analyzer To Back Up and Restore Files 1 Setting Up the Analyzer To Back Up Files from the Analyzer to an HP-UX Workstation 1 On the networked HP-UX workstation, NFS mount the analyzer file system under the local workstation file system, using the following command: /etc/mount :/IDE / 2 Copy all files and directories under // to your workstation file system or a backup device.
Setting Up the Analyzer To Back Up and Restore Files 5 At the A:\> prompt, type format/s C:\ This command formats drive C as a system disk. Caution All information on drive C is lost. 6 At the C:\> prompt, type mkdir C:\dos This command creates a DOS directory on drive C. 7 At the A:\> prompt, type copy msb*.* C:\dos This command copies all of the MS backup program files to the C:\DOS directory. 8 Type cd C:\dos and press Enter. 9 Type msbackup to start the backup/recovery program.
Setting Up the Analyzer To Back Up and Restore Files 1 Setting Up the Analyzer 9 Switch the analyzer power off for 5 seconds. See the MS-DOS User’s Guide and the Microsoft Windows User’s Guide for more information.
Setting Up the Analyzer To Insert or Remove an Interface Pod To Insert or Remove an Interface Pod Interface pods can be inserted or removed from the analyzer at any time. The power does not need to be switched off. You insert an interface pod when you initially set up the analyzer, and subsequently when you change the type of line to be monitored. Caution Handle the interface pod with extreme care to avoid electrostatic discharge (ESD) damage during unpacking, installation, and operation.
Setting Up the Analyzer To Insert or Remove an Interface Pod You must always have two interface pods inserted in the analyzer while it is operating. If your operations require only a single interface pod, insert the blank interface pod (provided with the analyzer) into the other port. 1 Setting Up the Analyzer Caution The two interface pods are necessary to maintain a balanced airflow for cooling of internal components and to comply with EMC emission standards.
Setting Up the Analyzer To Troubleshoot the Analyzer To Troubleshoot the Analyzer If the Power LED is Not On ❑ Check that the analyzer’s power switch is on. ❑ Check that the analyzer’s power cable is connected to the analyzer and plugged in to the power outlet, and the mains power is on. If the Power LED is Red When You Switch On the Analyzer If the Power LED flashes red, there is a hardware fault.
Setting Up the Analyzer To Troubleshoot the Analyzer 1 Setting Up the Analyzer If the Controlling Computer has No Display ❑ Check that the controlling computer power switch is on. ❑ Check that the power cable is properly connected to the controlling computer. ❑ Check that the brightness and contrast controls are correctly set. ❑ Check that the computer has only the software specified in “Analyzer Software” on page 1-4 loaded. Other software may interfere with the computer configuration.
Setting Up the Analyzer To Troubleshoot the Analyzer If the System Failure Window is Displayed ❑ Contact HP Customer Support. Print the window and fax it to HP Customer Support. See “To Print a Window” on page 1-33. Note If you cannot access the analyzer after performing the required checks, refer to the Worldwide Support card for information on how to obtain customer support.
Setting Up the Analyzer To Troubleshoot the Analyzer 1 Setting Up the Analyzer To Print a Window To Print a Window from the Notebook PC 1 Ensure that the printer is connected. 2 Make sure the window you want to print has the keyboard focus. 3 Press Alt-PrtSc. 4 From the Accessories program group, click the Paintbrush icon to open Paintbrush. 5 From the Edit menu, select Paste to copy the captured screen into Paintbrush. 6 From the File menu, select Print; then click OK.
Setting Up the Analyzer To Troubleshoot the Analyzer 1-34
2 Using the Analyzer 2 Using the Analyzer To Connect to the System Under Test 2-2 To Log In to the Analyzer 2-11 To Log Out from the Analyzer 2-16 To Configure the Analyzer and Ports 2-18 To Monitor the Link (Network) 2-20 To Monitor a Channel (VPI/VCI) 2-26 To Monitor Alarms and Errors 2-28 To Log Statistics 2-33 To Run SMARTtests and Predefined Macros 2-36 To Capture and View Data 2-38 To Simulate Traffic 2-44 To Inject Alarms and Errors 2-48 To Use Macros 2-54
Using the Analyzer To Connect to the System Under Test To Connect to the System Under Test 1 Before you connect to the system under test (SUT), ensure that • the analyzer is connected to the controlling computer (workstation or notebook PC) • two interface pods are inserted in the analyzer, one of which may be a blank pod 2 Connect the interface pod(s) to the SUT. Each interface pod has a transmit and receive connector on its front panel that you use to connect to the SUT.
Using the Analyzer To Connect to the System Under Test There are three system connection options: • • • intrusive non-intrusive diagnostic Intrusive System Connection 2 Using the Analyzer When you install or remove an intrusive system connection, it affects the traffic on the link to which the analyzer is connected. Either you need to take the link offline to make the connection, or you need to interrupt traffic.
Using the Analyzer To Connect to the System Under Test Port 1 Port 2 Tx Rx Equipment under test The network element connection is an out-of-service test, that is, the system is not live. Use this connection to check things such as • • • • protocol transfer and conversion connection verification quality of service parameters policing mechanisms Configure the affected port(s) for full duplex for the network element connection.
Using the Analyzer To Connect to the System Under Test A typical application for this type of test connection is testing the integrity of the system under test. The remote loopback test connection is similar to the network element test connection in its uses. However, while the network element connection tests a single element at a time, the remote loopback connection tests all network elements in the loop. Use this connection to monitor, capture, and transmit traffic.
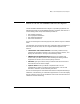
Using the Analyzer To Connect to the System Under Test Port 1 Port 2 Tx Rx Tx Rx Equipment under test When using an in-line test connection, configure the affected port(s) for a full duplex, regenerator, or loopthrough interface configuration (according to the type of interface pod installed). The disadvantage of the in-line test connection is that you need to break the link to install and remove the connection.
Using the Analyzer To Connect to the System Under Test Passive Test Connection Some ATM switches have dedicated test access ports. All traffic from the switch is transmitted through both the regular port and the dedicated test port. Connecting the analyzer to the dedicated test port is completely non-intrusive. This type of connection never interferes with live traffic, even during set up.
Using the Analyzer To Connect to the System Under Test Port 1 Tx Rx Port 2 T-piece Tx Rx Equipment under test When using a non intrusive, T-piece connection, the interface configuration of the analyzer is not important. The analyzer’s default configuration is full duplex. Diagnostic System Connection A diagnostic connection does not affect the traffic on the link to which the analyzer is connected. Use this connection when you want to test the analyzer.
Using the Analyzer To Connect to the System Under Test Transmit Loopback Test Connection Port 1 Port 2 Tx Rx Equipment under test 2 Using the Analyzer Transmit loopback is both an interface configuration option and a test connection. Transmitted data is directed both out of the transmit connector and internally (within the interface pod) to the measurement system. The analyzer ignores external connections to the receive connector.
Using the Analyzer To Connect to the System Under Test Port 1 Port 2 Port 1 Port 2 You can perform this test using either a single port with a single interface, or across two ports using two interfaces of the same line rate and configuration. For example, you can make an external loopback connection across two ports, between two OC-3/STM-1 interfaces. Use the external loopback connection to monitor, capture, and transmit traffic.
Using the Analyzer To Log In to the Analyzer To Log In to the Analyzer To start up the HP Broadband Service Analyzer from the notebook PC, you must double-click the appropriate icon in the HP Broadband Analyzer program group. You can display either the analyzer Graphical User Interface, or the analyzer Command Line Interface. 2 Using the Analyzer If at any time you cannot log in to the analyzer, reboot the notebook PC by pressing Ctrl-Alt-Del.
Using the Analyzer To Log In to the Analyzer The HP Broadband Service Analyzer Login window is displayed after you double-click an icon. 1 Type your user name. You are assigned a user name by your System Administrator. 3 Click OK. 2 Type your password. Note The HP Broadband Service Analyzer has two sets of default login information: • User Name—boomer • User Name—root Password—broadband Password—rootpasswd The analyzer checks the information that you entered.
Using the Analyzer To Log In to the Analyzer If at any time you cannot log in to the analyzer, reboot the notebook PC in one of the following ways: • • Press the Reset button underneath the PC. Press Ctrl-Alt-Del. If you still cannot log in, refer to the Worldwide Support card for information about how to obtain customer support.
Using the Analyzer To Log In to the Analyzer The Command Line Interface Login window is displayed. 1 Type your login name. You are assigned a login name by your System Administrator. 2 Type your password. The CLI (Command Line Interface) accepts Tcl (Tool Command Language) commands, not UNIX commands. Tcl is the scripting language used in macros.
Using the Analyzer To Log In to the Analyzer A port is active as soon as an interface pod is inserted. The left side of the screen displays information about port 1, and the right side of the screen displays information about port 2. Measurement Controls. Start, stop, or reset the measurement system and analyzer configuration. See “To Configure the Analyzer and Ports” on page 2-18. Menu Bar. Link Monitor. See “To Monitor the Link (Network)” on page 2-20 and “To Monitor a Channel (VPI/VCI)” on page 2-26.
Using the Analyzer To Log Out from the Analyzer To Log Out from the Analyzer 1 From the File menu, select Exit. or 1 Double-click the Controlmenu box. 2 Click Yes. If you are logging alarms and errors when you log out, the analyzer displays a message reminding you that you are still logging. When you exit the analyzer, logging stops.
Using the Analyzer To Log Out from the Analyzer If you are using a modem connection, you must disconnect the modem. 1 Double-click on the Dialer icon in the Acadia/VxD program group. The Ipswitch, Inc. SLIP/PPP Configure & Dial window displays. 2 Select e5200a from the Phonebook list. 3 Click the Hangup button. The connection closes. After you have logged out, switch off the analyzer. See “To Switch the Analyzer On and Off” on page 1-22.
Using the Analyzer To Configure the Analyzer and Ports To Configure the Analyzer and Ports After you log in you must configure the analyzer for the type of test you want to perform, then specify the ATM and physical layer configuration for each port. To Configure the Analyzer 1 From the Configure menu, select the appropriate port. 2 Select the required configuration option: • • • • Select full duplex for intrusive tests. Select transmit loopback for diagnostic tests.
Using the Analyzer To Configure the Analyzer and Ports Caution You should reconfigure the ports only when the measurement system is stopped. Reconfiguring the ports causes the measurements and some data to be lost. A warning message appears when this occurs. To Manually Configure Each Port 1 Click the physical layer tab; then specify the physical layer configuration parameters for the port. 3 Click the Signaling tab; then specify the signaling configuration parameters for the port.
Using the Analyzer To Monitor the Link (Network) To Monitor the Link (Network) While the measurement system is on, the analyzer continuously measures the key indicators of the health of the link, and displays that information in an easy-to-read summary format. To start the measurement system, click the Start button on the main screen. Use Link Monitor to see overall trend information. It provides an overview of what is happening in the link and highlights any abnormalities.
Using the Analyzer To Monitor the Link (Network) Link Monitor is divided into two main areas. Link summary graphs 2 Using the Analyzer Channel summary Link Summary These graphs show you a summary of the condition of the link. You can double-click each graph to enlarge it and see detailed information. These measurements are current, and the values are updated in real-time while you view the graph.
Using the Analyzer To Monitor the Link (Network) 10 Highest Mb/s Graph The first link summary graph shows the ten channels in the link that are using the largest amounts of bandwidth. When you click a bar in the graph, the VPI and VCI are shown under the graph and the channel is highlighted in the channel summary.
Using the Analyzer To Monitor the Link (Network) Total Mb/s Graph The third link summary graph shows the maximum sample bandwidth usage over time. There is a vertical indicator on the right side of the graph. You can click the graph to move the vertical indicator to different positions and see what the bandwidth usage was at any time during the previous 300 seconds (5 minutes). The bandwidth usage is shown under the graph in Mb/s.
Using the Analyzer To Monitor the Link (Network) Channel Summary Virtual Channel Identifier (VCI) in decimal. Virtual Path Identifier (VPI) in decimal. Display Channel Monitor for the selected channel. Maximum sample bandwidth. AAL type. Capture data. The table at the bottom of Link Monitor is a summary of the first 1023 active channels (VPI/VCI) that the analyzer reads for each port (shown in the order in which they were detected) and one user-selected channel (selected through Channel Monitor).
Using the Analyzer To Monitor the Link (Network) To select a specific channel 1 Start Channel Monitor. 2 Click the Set Up button. 3 Type the VPI and VCI to set up a new channel. 4 Select either automatic decode or manual decode to set the PRBS pattern or AAL type. 5 Click OK. 2 Using the Analyzer See also “To Monitor a Channel (VPI/VCI)” on page 2-26.
Using the Analyzer To Monitor a Channel (VPI/VCI) To Monitor a Channel (VPI/VCI) Channel Monitor displays a summary of bandwidth usage, alarms, and errors over the past 300 seconds (5 minutes) for individual channels within the link. It works together with Link Monitor, which gives you a summary of up to 1024 active channels in the link. When you find a channel of interest, or an error or abnormality in Link Monitor, you can use Channel Monitor to look at specific channels in greater detail.
Using the Analyzer To Monitor a Channel (VPI/VCI) Select the VPI/VCI and MID (for AAL-3/4) of the channel you want to view. If required, select the AAL type for the channel. The analyzer automatically detects the AAL type. Alarms and errors that occurred during the past 300 seconds for each protocol layer. To display more detailed information about a particular layer, click one of the protocol tabs. See “To Monitor Alarms and Errors on a Channel” on page 2-31.
Using the Analyzer To Monitor Alarms and Errors To Monitor Alarms and Errors The analyzer can display a summary of the alarms and errors at both the link and channel level. You can select the way you want to view the error statistics using the pulldown lists on the status screens.
Using the Analyzer To Monitor Alarms and Errors 2 Using the Analyzer 1 Click an alarm and error status indicator to display the summary window for a specific protocol layer. 2 Select to display the errors as a count, a ratio, or seconds. The color assignments are the same as for the higher level (summary) indicators. Alarms of similar durations or errors with similar counts are usually related.
Using the Analyzer To Monitor Alarms and Errors The status windows display the following information: • Physical Layer ❍ ❍ • ATM Layer ❍ ❍ ❍ • ❍ ❍ ❍ affected channel (VPI/VCI) for each AAL type Sequence Number and Cell Loss errors for AAL-1 CRC errors for AAL-3/4 and AAL-5 number of affected channels OAM ❍ ❍ ❍ ❍ 2-30 types of alarms and the number of one-second intervals that contain each alarm count and bandwidth of ATM cells a summary of errors displayed as seconds, count, or ratio ATM Adapta
Using the Analyzer To Monitor Alarms and Errors To Monitor Alarms and Errors on a Channel Alarms and errors on a channel are displayed in Channel Monitor. To start Channel Monitor see “To Monitor a Channel (VPI/VCI)” on page 2-26. The summary shows details of the alarms and errors that occurred at each layer. Click a tab for more information about ATM and AAL alarms and errors. Ensure you select the Summary tab. Use Channel Monitor to interpret the effects of the alarms and errors.
Using the Analyzer To Monitor Alarms and Errors Click a protocol tab to view detailed information about the alarms, errors, and other statistics for a specific protocol. Note All alarms and errors that occur at the physical layer affect the ATM layer, and might render all ATM statistics invalid.
Using the Analyzer To Log Statistics To Log Statistics 3 Specify whether you want to log predefined statistics, userdefined statistics, or both. 2 Using the Analyzer 4 Turn logging on/off. 2 If required, append the new statistics to the end of an existing log file. 1 Specify the file to which you want to log statistics. When you click the On button, the statistics you define are logged to the specified file. Logging continues until you click the Stop button.
Using the Analyzer To Log Statistics 1 Select the port for which you want to display the statistics. 2 Select the layer for which you want to display the statistics. 3 Click one or more of the available variants. 4 Click Select. To Print the Log File Click the Stop button to stop logging statistics; then click the Print button to send the contents of the log file to the default printer. You cannot print the log file while you are still logging statistics.
Using the Analyzer To Log Statistics To View the Log File Log files are formatted as straight text. You can view log files up to 32,000 bytes in size using the macro editor. 1 Click the Stop button in the Log window to stop logging statistics. 2 From the Macro menu, select Edit to display the macro editor. 3 Specify the name of the log file you want to view. The analyzer displays the named log file in the editor window.
Using the Analyzer To Run SMARTtests and Predefined Macros To Run SMARTtests and Predefined Macros The analyzer provides a number of SMARTtests and predefined macros to help you perform routine tasks. SMARTtests Simply select a SMARTtest from the Test pull-down list at the top of the main screen, change any default values you require, and click the Start button. It’s as easy as 1, 2, 3; the analyzer does the rest. If you are not sure which SMARTtest to run, see the User Online Help.
Using the Analyzer To Run SMARTtests and Predefined Macros Before the SMARTtest starts to run, the analyzer checks to make sure the affected ports are configured in full duplex mode and that there are no alarms present. If either of these conditions is not met, an error message appears and the SMARTtest does not run. The figure at the bottom of the window starts running to indicate that the SMARTtest has started, and relevant details are shown on the window as the SMARTtest runs.
Using the Analyzer To Capture and View Data To Capture and View Data You can capture real data from the link at any time and use it for testing and analysis. The analyzer captures incoming data from one or more ports at full line rates up to 155 Mb/s. Capture data when you want to analyze a fault condition or see what the data actually looks like.
Using the Analyzer To Capture and View Data To Capture Data Display the View Captured Data window for a single port in one of the following ways: From the Monitor menu, select the required port; then select the Capture option. • From Link Monitor, click a channel in the channel summary; then click the Capture button. • From Channel Monitor, click the Capture button. • From the AAL error or OAM alarm summary, click the Capture button. • From the Simulator, click the Capture icon.
Using the Analyzer To Capture and View Data 5 Start the capture. 1 Select whether you want to capture cells or AAL-5 frames. 2 Select the type of data you want to capture. 3 If required, select the events to start and stop the capture. 4 If required, select to capture cells that match a specific pattern only. Click the Patterns button if you want to define a capture pattern. Click the Triggers button if you want to select interface pod capture events to trigger the capture.
Using the Analyzer To Capture and View Data To View Captured Data After you capture or load data, it is displayed on the View Captured Data window. You can use this window to view different portions of the data, and save it to a file using the Save option on the File menu. Save your captured data files in the following directory: /USR/E5200A/HOME/[USERNAME]/PDU Continue capturing data after you have stopped a capture. Stop capturing data. Set up the data to capture. Start capturing data.
Using the Analyzer To Capture and View Data To use Data Captured by the Analyzer on a BSTS If you are using the analyzer on a series 400 or series 700 HP-UX workstation, you can convert the Broadband Service Analyzer captured data files into Broadband Series Test System (BSTS) data files. Ensure that the Data Conversion Utility (p/n E5200-10010) is installed. See the Installing/Upgrading Software section in the HP BSTS System Installation & Startup Guide.
Using the Analyzer To Capture and View Data 4 Click the converted data file in the list; then click OK. The captured data file is displayed on the BSTS Playback Recording window.
Using the Analyzer To Simulate Traffic To Simulate Traffic The Simulator is like a toolbox, filled with all of the tools you need for manual control of the transmit functions of the analyzer. Use the Simulator to customize traffic and simulate actual traffic conditions; then transmit the traffic into the system under test.
Using the Analyzer To Simulate Traffic Select to generate traffic or replay captured data. Display the View Captured Data window to capture data. See “To View Captured Data” on page 2-41. Display the Simulate Traffic window to select the traffic to transmit. Select the configuration for the port. See “To Configure the Analyzer and Ports” on page 2-18. Display the Physical Alarms/ Errors window to simulate physical layer alarms, errors, or PLCP frameword errors.
Using the Analyzer To Simulate Traffic To Simulate Traffic from the Traffic Generator 3 Edit the encode options for each channel if required. 4 Set the traffic profile and bandwidth for the foreground channel. 5 Select to transmit data continuously or as single cells for the foreground channel. 2 Enter the VPI/VCI for each channel. 1 Select the channels on which you want to transmit data. Channel 0 is the foreground channel, and channels 1—10 are background channels.
Using the Analyzer To Simulate Traffic To Simulate Traffic from Capture Memory 1 Select to transmit continuously or as single cells. If you select single cells, click the Transmit button to transmit. Click this button to change the profile (distribution and bandwidth). View the contents of the capture memory or capture new data from the link. 2-47 2 Using the Analyzer 2 Select the traffic profile you want to use. The currently selected profile is shown on the button.
Using the Analyzer To Inject Alarms and Errors To Inject Alarms and Errors The analyzer can generate the following types of alarms and errors: • • • protocol layer alarms and errors physical layer alarms and errors frameword errors You must be transmitting traffic to be able to inject alarms or errors. For more details about simulating and injecting alarms and errors, see the User Online Help.
Using the Analyzer To Inject Alarms and Errors To Inject OAM Alarms 1 Click the OAM Alarms tab. 2 Enter details about the type of alarm you want to simulate (either F4 or F5). 2-49 2 Using the Analyzer 3 Click the On button to start injecting OAM cells, or click the Inject button to inject a specified number of OAM cells.
Using the Analyzer To Inject Alarms and Errors To Inject ATM and AAL errors 1 Click the Errors tab. 2 Select the channel(s) on which to simulate 5 Click the bits you want to error. 6 Click the On button to start injecting errors, or click the Error On For or the Error Off For button to transmit errors for a specified number of cells. 3 Select the type of error. 4 If required, select the part of the cell to error. Watch the results of the injected alarms or errors.
Using the Analyzer To Inject Alarms and Errors To Inject Physical Layer Alarms and Errors The analyzer can generate physical layer alarms and errors, and frameword errors. Display the Protocol Alarms/Errors window in either of the following ways: From the Simulate menu, select the required port; then select Physical Alarms/Errors. • Click the Simulate tab for the required port to display the Simulator; then click the Physical Alarms/Errors button.
Using the Analyzer To Inject Alarms and Errors To Inject Physical Errors 1 Click the Errors tab. 2 Select the type of error to inject. 3 Enter the rate at which you want to inject errors; then click the On button to start injecting errors. or 3 Click the Inject button each time you want to inject a single error. The type of errors you can inject depends on the interface pods installed. Watch the results of the injected alarms or errors.
Using the Analyzer To Inject Alarms and Errors To Inject Frameword Errors 3 Click the On button. 2 Click the bits you want to error. You simulate frameword errors to stress the framing mechanisms of network elements and ensure that they react correctly to the errors. 2-53 2 Using the Analyzer 1 Click the Frameword tab.
Using the Analyzer To Use Macros To Use Macros You can use the Broadband Service Analyzer to create macros. A macro is a file that contains a list of actions required to perform a task. After you create a macro, you can repeat the actions as many times as you want simply by playing the macro. Macros are particularly useful for repetitive tasks such as running a series of tests. The analyzer also provides a number of predefined macros that you can run to perform common tasks.
Using the Analyzer To Use Macros To Create a Macro 2 Using the Analyzer 1 Type a name for your macro file; then click OK. Click the Open File button to display the Select File window. 2 Click the Record button and perform the actions that you want to record. 3 Click the Stop button to stop recording the macro. Click the Save Session button if you want to save your session. Click the Pause button to pause the recording. Any actions you make while the macro is paused are not recorded.
Using the Analyzer To Use Macros To Edit a Macro 1 From the Macro menu, select Edit to display the Select File window. 2 Type the name of the macro that you want to edit, or select the file from the list. The macro is shown in the Edit window. 3 Edit the macro to add functions, such as looping and procedure control. See the Macro Online Help for information on macro commands and functions. 4 From the Macro Editor’s File menu, select Save to save your changes. 5 Test your changes by playing the macro.
3 To Install the Online Help 3-2 To Display the Online Help 3-5 3 Using the Online Help Using the Online Help
Using the Online Help To Install the Online Help To Install the Online Help You should install the online help when you receive a new version of the analyzer software, or if you are setting up the analyzer to use on a networked system (see “To Connect the Analyzer as a Networked System” on page 1-10). To Install the Online Help on a PC You can install the analyzer online help on any PC with Windows 3.1 or higher. 1 Insert the Help for Windows diskette 1 (p/n E5200-10017) in drive A.
Using the Online Help To Install the Online Help To Install the Online Help on a Workstation If you have HP-UX superuser permission, you can install the analyzer help on an HP series 700 workstation running HP-UX 9.05. Note • • This installation modifies the following files: /etc/inetd.conf /etc/services 1 Mount the CD-ROM onto your file system by typing: /bin/mkdir /cdrom /etc/mount /cdrom See your system administrator if you are unsure of the CD-ROM device file name.
Using the Online Help To Install the Online Help 7 Select “All Filesets on the Source Media” by using the arrow keys to highlight the option; then pressing either Enter or F4. The Select All Filesets on the Source Media window is displayed. 8 Select “Start Loading Now” by using the arrow keys to highlight the option; then pressing either Enter or F4. A message window is displayed asking you whether you want to “Start loading filesets now?” 9 Type y. The Loading Partitions and Filesets window is displayed.
Using the Online Help To Display the Online Help To Display the Online Help The analyzer’s online help consists of three volumes: • • • User Online Help which contains ❍ instructions for the most common tasks ❍ reference topics that provide background information for those tasks ❍ a glossary ❍ descriptions of all screens, windows, fields, icons, buttons and messages (context-sensitive help) Macro Online Help which contains all of the information you need to record, edit, and run your own macros UPE Compa
Using the Online Help To Display the Online Help To Display the Help Version Details Make sure that the version number of the help you are currently viewing matches the version number of your HP Broadband Service Analyzer. 1 From the analyzer main screen Help menu, select the About the Analyzer option to find the version number of your HP Broadband Service Analyzer. 2 From within any of the help contents screens, click the book icon in the top left corner to find the help version.
Using the Online Help To Display the Online Help Help Hint Bar Help hint bar The help hint bar at the bottom of the main screen displays a brief description of the field, icon, button, or menu option over which the cursor is currently positioned. Help hint information is available for both entry and non-entry fields.
Using the Online Help To Display the Online Help 3-8
4 To Use the System Administration Functions 4-2 To Change a Password 4-6 To Set the System Date, Time, and Time Zone 4-7 To Upgrade the Analyzer Software 4-10 System Administration 4 System Administration
System Administration To Use the System Administration Functions To Use the System Administration Functions You can perform the following system administration functions: • • • change a password set the system date and time upgrade software If you have the required privileges, you can also perform one or more of the following system administration functions: • • • • • • • • set LAN and bootstrap parameters manage remote host details re-initialize the hard disk manage routing details manage remote file s
System Administration To Use the System Administration Functions • • • click the HP Analyzer Terminal icon or the HP Analyzer Terminal Over SLIP icon in the HP Broadband Service Analyzer program group remotely log in through a Telnet session (see the User Online Help) use the analyzer Graphical User Interface To Start the System Administration Functions Using the Graphical User Interface. See the User Online Help for more information about logging into the system administration functions.
System Administration To Use the System Administration Functions To Move Around in the System Administration Functions The first screen displayed in the system administration functions is the System Administration Functions Main Menu. This menu displays a list of all of the functions you have authorization to perform. To select a function, type the number corresponding to the required function; then press Enter. All screens have an Exit option (0 on menus or ^ on screens).
System Administration To Use the System Administration Functions If a screen has multiple entry fields, the fields are displayed one at a time. You must complete one field and then press Enter to display the next field. You cannot go back to a completed field after you press Enter; if you need to change a field you must complete all fields again. To Change a Completed Field 1 Type ! 2 Press Enter to cancel the change and return to the previous menu. 3 Start again.
System Administration To Change a Password To Change a Password Your password must be a minimum of 8 characters and no more than 40 characters. At least one of the characters must not be alphanumeric. Follow your standard business practices for changing passwords. Make sure your password is not easily recognizable, such as your name. To select the Change Password option from the System Administration Functions Main Menu, type 1; then press Enter to display the Change Password screen.
System Administration To Set the System Date, Time, and Time Zone To Set the System Date, Time, and Time Zone When you first install the analyzer, the time and date are set to GMT. You should change the time, date, and time zone to that of your location. If you move the analyzer to a different time zone, reset only the time zone. The analyzer automatically resets the time and date. You should, however, check that the time and date have been set correctly.
System Administration To Set the System Date, Time, and Time Zone To Change the System Date and Time If you need to change the system time and date, type 1 on the Change Current Date and Time screen; then press Enter to go to the Change Current Date and Time screen. 1 Type the date in the format dd-mm-yy; then press Enter. 2 Type the time in the format hh:mm:ss; then press Enter. 3 Press Enter.
System Administration To Set the System Date, Time, and Time Zone To Change the System Time Zone To change the system time zone, type 2 on the Change Current Date and Time screen; then press Enter to go to the Change Time Zone screen. 1 Scroll through the list to find the required time zone location. 2 Type the number corresponding to the location for which you want to set the time; then press Enter. 3 Press Enter.
System Administration To Upgrade the Analyzer Software To Upgrade the Analyzer Software There are two ways to upgrade the analyzer software when a new version of the software is released: • • diskettes File Transfer Protocol (FTP) from a remote host using either floppy diskettes or a CD-ROM Before you upgrade the analyzer software, you should back up all of the files on the analyzer hard disk. See “To Back Up and Restore Files” on page 1-23.
System Administration To Upgrade the Analyzer Software To Upgrade Software Using Diskettes From the Upgrade Software Menu, type 1; then press Enter to display the Upgrade Software Using Diskettes screen. 1 Insert each diskette provided into drive A on the PC according to the instructions on the screen. 2 Press Enter. Press Enter. When you have correctly installed the software, the message, Upgrade complete appears. If the upgrade does not work, the message Upgrade failed appears.
System Administration To Upgrade the Analyzer Software To Upgrade Software Using FTP If you are using the Upgrade floppy diskettes 1 Create a directory on your notebook PC or workstation called FTPIMAGE. 2 Copy the contents of the \E5200A\ directory from each Upgrade diskette to the new FTPIMAGE directory. From the Upgrade Software Menu, type 2; then press Enter to display the Upgrade Software Using an FTP Site screen. 1 Type the hostname of your FTP site; then press Enter.
System Administration To Upgrade the Analyzer Software Log in to the analyzer (see “To Log In to the Analyzer” on page 2-11); then back up the analyzer to the notebook PC to the c:\usr directory (see “To Back Up Files from the Analyzer to a Notebook PC” on page 1-24), or to an HP-UX workstation (see “To Back Up Files from the Analyzer to an HP-UX Workstation” on page 1-25).
System Administration To Upgrade the Analyzer Software 4-14
5 Standards and Specifications 5 Standards and Specifications Standards 5-2 Electrical Specifications 5-3 External Connectors 5-4 Timing and Frequency References 5-10 Foreground Traffic Generation 5-11 Traffic Loading 5-11 Error Generation 5-12 Measurement System 5-12 Capture and Playback System 5-13 Mechanical and Environmental Specifications 5-14
Standards and Specifications Standards Standards Communications Standards 5-2 ITU Rec. G.703 General Aspects of Digital Transmission Systems—Terminal Equipment Physical/Electrical Characteristics of Hierarchical Digital Interfaces IEEE 802.
Standards and Specifications Electrical Specifications 5 Standards and Specifications Electrical Specifications Power Requirements (Mains) Parameter Nominal Minimum Power Maximum Notes 450 VA AC Voltage—low range 100-120 V −15% +10% auto voltage selection AC Voltage—high range 200-240 V −15% +10% auto voltage selection 47 Hz 63 Hz Frequency 5-3
Standards and Specifications External Connectors External Connectors RS-232 Serial Port Conforms to ANSI/EIA/TIA-232-E (1991).
Standards and Specifications External Connectors 5 Standards and Specifications Ethertwist LAN (RJ-45) UTP Connector Conforms to ANSI/IEEE 802.3-1993.
Standards and Specifications External Connectors AUI LAN (AUI DB-15F) Connector Conforms to ANSI/IEEE 802.3-1993. Parameter Nominal Minimum Maximum DC output—voltage rating 12 V 11.7 V 12.6 V DC output—current rating 5-6 Pin Number Function 1 Ground 2 Control in + 3 Data out + 4 Ground 5 Data in + 6 Ground 7 Not used 8 Ground 9 Control in − 10 Data out − 11 Ground 12 Data in − 13 +12Vout 14 Ground 15 Not used 0.
Standards and Specifications External Connectors Parameter Nominal Minimum Maximum Notes T1 signal stream 1.544 MHz −25 ppm +25 ppm conforms to ANSI T1.102 E1 signal stream 2.048 MHz −25 ppm +25 ppm conforms to ITU G.703 8/64 kHz composite clock 64 kHz −25 ppm +25 ppm conforms to Bellcore TA-TSY-000378 Transmit clock 1.544 MHz −25 ppm +25 ppm all 1’s signal stream when locked to reference Transmit clock 1.
Standards and Specifications External Connectors Sync In Connector (DE9P) Parameter Nominal Minimum Maximum Reference frequency 1 MHz −25 Hz +25 Hz Input duty cycle 45% 55% Input voltage (Logic-O) 0V 1.5 V Input voltage (Logic-1) 3.
Standards and Specifications External Connectors Parameter Nominal Minimum Maximum Reference frequency 1 MHz −25 Hz +25 Hz Output duty cycle 45% 55% Output voltage (Logic-0) 0V 0.
Standards and Specifications Timing and Frequency References Timing and Frequency References 5-10 Parameter Nominal Minimum Maximum Notes Internal reference frequency 19.44 MHz −4.6 ppm +4.6 ppm stratum 3 source External reference frequency 1 MHz −25 Hz +25 Hz Recovered clock frequency fo −25 Hz +25 Hz fo = port 1 or 2 interface pod rate BITS—T1 reference 1.
Standards and Specifications Foreground Traffic Generation 5 Standards and Specifications Foreground Traffic Generation Parameter Nominal Minimum Maximum Notes Frequency Range 10 b/s 149.
Standards and Specifications Foreground Traffic Generation Error Generation Parameter Nominal ATM PDU error— burst length Minimum Maximum Notes 1 PDU 63 PDUs Number of consecutive errored PDUs. Applied to a single VPI/VCI or all cells. Minimum Maximum Notes 3 sec 72 hours (3 days) −4.6 ppm +4.6 ppm locked to internal reference −4.6 ppm +4.
Standards and Specifications Capture and Playback System 5 Standards and Specifications Capture and Playback System Capacity Parameter Nominal Minimum Maximum Notes Capture memory per port 1 MB 7 MB 1 MB reserved for foreground traffic generation Playback memory per port 1 MB 8 MB Minimum Maximum Notes Frequency range 100 b/s 149.
Standards and Specifications Mechanical and Environmental Specifications Mechanical and Environmental Specifications Physical Size 335 mm x 440 mm x 100 mm (13.19 in x 17.32 in x 3.93 in) Weight 6 kg nominal (13.
Standards and Specifications Mechanical and Environmental Specifications Analyzer with or without notebook Operating Humidity 15 to 90% relative humidity at 40°C maximum Storage Humidity 90% relative humidity at 65°C maximum Altitude Parameter Maximum Operating 4.6 km Storage 4.
Standards and Specifications Mechanical and Environmental Specifications 5-16
A Hexadecimal to ASCII Conversion A-2 A Hexadecimal to ASCII Conversion Hexadecimal to ASCII Conversion
Hexadecimal to ASCII Conversion Hexadecimal to ASCII Conversion Hexadecimal to ASCII Conversion The following table shows hexadecimal codes and their ASCII equivalents. Use this table when editing PDUs and transmitting byte values. Hex 20 21 22 23 24 25 26 27 28 29 2A 2B 2C 2D 2E 2F 30 31 32 33 34 35 36 37 • • A-2 ASCII [space] ! “ # $ % & ‘ ( ) * + , .
B Default Acadia Configuration B-2 B Default Acadia Configuration Default Acadia Configuration
Default Acadia Configuration Default Acadia Configuration Default Acadia Configuration Acadia/Vxd has the following default configuration values. Host table 127.0.0.1 localhost 10.0.0.2 e5200apc 10.0.0.1 15200a 10.0.1.1 e5200a_slip 10.0.1.2 e5200apc_slip Domain name information no default configuration IP address IP address 10.0.0.2 Netmask 255.255.255.
Default Acadia Configuration Default Acadia Configuration NFS Services c:\usr\e5200a c:\e5200a a:\e5200a B Default Acadia Configuration TCP/IP Services [X] File Transfer (FTP) [X] Finger [ ] Printing (LPD) [X] Remote Command (REXEC) [X] Remote shell (RSH) [X] Telnet [X] Trivial File Transfer (TFTP) User Authorization no default configuration B-3
Default Acadia Configuration Default Acadia Configuration Category Environment B-4 etc c:\acadia\etc _hostname e5200apc term ibmpc users guest vt100cmap c:\acadia\etc\telnet.att vt100kmap c:\acadia\etc\vtket.
Index A AAL monitor alarms and errors, 2-30 acadia configuration, default, B-2 domain name information, B-2 host table, B-2 IP address, B-2 NFS services, B-3 TCP/IP services, B-3 user authorization, B-3 alarms inject, 2-48 physical, 2-51 protocol, 2-48 log, 2-33 monitor, 2-28 AAL, 2-30 ATM layer, 2-30 OAM, 2-30 per channel, 2-31 per link, 2-28 physical layer, 2-30 ASCII to hexadecimal conversion, A-2 ATM layer monitor alarms and errors, 2-30 AUI LAN connector, 5-6 B backup files, 1-23, 1-24 create a bootab
Index physical, 5-14 temperature, 5-14 error generation specifications, 5-12 errors inject, 2-48 physical, 2-51 protocol, 2-48 log, 2-33 monitor, 2-28 AAL, 2-30 ATM layer, 2-30 physical layer, 2-30 ethernet interface, 1-8 external connectors, 1-5, 5-4 AUI LAN, 5-6 BITS input, 5-7 serial port, 5-4 Sync In, 5-7, 5-8 Sync Out, 5-9 UTP LAN, 5-5 external loopback test connection, 2-9 F File Transfer Protocol upgrade software, 4-12 foreground traffic generation specifications, 5-11 frameword errors, 2-53 inject,
Index alarms and errors, 2-28 AAL, 2-30 ATM layer, 2-30 OAM, 2-30 per channel, 2-31 per link, 2-28 physical layer, 2-30 channel, 2-26 link (network) 10 Highest Mb/s graph, 2-22 AAL Usage graph, 2-22 channel summary, 2-24 link summary, 2-21 Total Mb/s graph, 2-23 N Network Configuration Facility, 1-20 network connectivity, 1-13 network element test connection, 2-3 network, monitor, See Link Monitor NFS services default configuration, B-3 O OAM monitor alarms, 2-30 online help install for workstation, 1-13 P
Index mechanical and environmental, 5-14 altitude, 5-15 humidity, 5-15 physical, 5-14 temperature, 5-14 timing and frequency references, 5-10 traffic loading, 5-11 Sync In connector, 5-7, 5-8 Sync Out connector, 5-9 system administration functions, 4-2 change a password, 4-6 navigate, 4-3, 4-4 select, 4-4 set the system date, time, and time zone change the system time zone, 4-9 start, 4-2 system date, time, and time zone change the system date and time, 4-8 upgrade software, 4-10 diskettes, 4-11 File Trans