
R211x-HP Flexfabric 11900 Fundamentals Command Reference
231
display cpu-usage history
Use display cpu-usage history to display the historical CPU usage statistics in charts.
Syntax
In standalone mode:
display cpu-usage history [ job job-id ] [ slot slot-number [ cpu cpu-number ] ]
In IRF mode:
display cpu-usage history [ job job-id ] [ chassis chassis-number slot slot-number [ cpu cpu-number ] ]
Views
Any view
Predefined user roles
network-admin
network-operator
mdc-admin
mdc-operator
Parameters
job job-id: Specifies a process by its ID. Without this option, the command displays the historical CPU
usage statistics for the entire system, which is the sum of the historical CPU usage statistics for all
processes in the system. To view the IDs and names of the running processes, use the display process
command. For more information, see Network Management and Monitoring Configuration Guide.
slot slot-number: Specifies a card by its slot number. Without this option, the command displays the
historical CPU usage statistics for the active MPU. (In standalone mode.)
chassis chassis-number slot slot-number: Specifies a card on an IRF member device by its slot number
and the member ID. Without this option, this command displays the historical CPU usage statistics for all
cards in the IRF fabric. (In IRF mode.)
cpu cpu-number: Displays the historical CPU usage statistics. The cpu-number argument can only be 0.
Usage guidelines
The system regularly collects CPU usage statistics and saves the statistics in the history record area. This
command displays the CPU usage statistics for the last 60 minutes in axes as follows:
• The vertical axis represents the CPU usage. If a statistic is not a multiple of the usage step, it is
rounded up or down to the closest multiple of the usage step, whichever is closer. For example, if the
CPU usage step is 5%, the statistic 53% is rounded up to 55%, and the statistic 52% is rounded
down to 50%.
• The horizontal axis represents the time.
• Consecutive pound signs (#) indicate the CPU usage at a specific time. The value on the vertical
axis for the topmost pound sign at a specific time represents the CPU usage at that time.
Examples
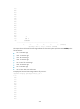
# Display the historical CPU usage statistics for the entire system.
<Sysname> display cpu-usage history
100%|
95%|