HP FlexFabric 11900 Switch Series Network Management and Monitoring Configuration Guide Part number: 5998-5265 Software version: Release 2111 and later Document version: 6W100-20140110
Legal and notice information © Copyright 2014 Hewlett-Packard Development Company, L.P. No part of this documentation may be reproduced or transmitted in any form or by any means without prior written consent of Hewlett-Packard Development Company, L.P. The information contained herein is subject to change without notice.
Contents Using ping, tracert, and system debugging ··············································································································· 1 Ping ····················································································································································································· 1 Using a ping command to test network connectivity ···························································································· 1 Ping example
Configuration example for NTP broadcast mode with authentication ····································································· 45 Configuration example for MPLS VPN time synchronization in client/server mode ·············································· 48 Configuration example for MPLS VPN time synchronization in symmetric active/passive mode ························· 49 Configuring SNTP ··············································································································
Enabling SNMP notifications ······························································································································· 80 Configuring the SNMP agent to send notifications to a host ··········································································· 80 Displaying the SNMP settings······································································································································· 83 SNMPv1/SNMPv2c configuration example ···········
Configuring the ICMP template ························································································································· 118 Configuring the DNS template··························································································································· 118 Configuring the TCP template ···························································································································· 119 Configuring the HTTP template ············
Layer 3 remote port mirroring configuration example ···················································································· 170 Configuring traffic mirroring ·································································································································· 173 Overview······································································································································································· 173 Local traffic mirroring ·
Documents ···························································································································································· 198 Websites······························································································································································· 198 Conventions ·····························································································································································
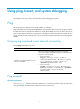
Using ping, tracert, and system debugging This chapter covers ping, tracert, and information about debugging the system. Ping Use the ping utility to determine if a specific address is reachable. Ping sends ICMP echo requests (ECHO-REQUEST) to the destination device. Upon receiving the requests, the destination device responds with ICMP echo replies (ECHO-REPLY) to the source device.
Figure 1 Network diagram Configuration procedure # Use the ping command on Device A to test connectivity to Device C. Ping 1.1.2.2 (1.1.2.2): 56 data bytes, press CTRL_C to break 56 bytes from 1.1.2.2: icmp_seq=0 ttl=254 time=2.137 ms 56 bytes from 1.1.2.2: icmp_seq=1 ttl=254 time=2.051 ms 56 bytes from 1.1.2.2: icmp_seq=2 ttl=254 time=1.996 ms 56 bytes from 1.1.2.2: icmp_seq=3 ttl=254 time=1.963 ms 56 bytes from 1.1.2.2: icmp_seq=4 ttl=254 time=1.991 ms --- Ping statistics for 1.1.2.
2. The intermediate device (Device B) adds the IP address of its outbound interface (1.1.2.1) to the RR option of the ICMP echo request, and forwards the packet. 3. Upon receiving the request, the destination device copies the RR option in the request and adds the IP address of its outbound interface (1.1.2.2) to the RR option. Then the destination device sends an ICMP echo reply. 4. The intermediate device adds the IP address of its outbound interface (1.1.1.
6. The source device thinks that the packet has reached the destination device after receiving the port-unreachable ICMP message, and the path to the destination device is 1.1.1.2 to 1.1.2.2 to 1.1.3.2. Prerequisites Before you use a tracert command, perform the tasks in this section. For an IPv4 network: • Enable sending of ICMP timeout packets on the intermediate devices (devices between the source and destination devices).
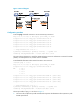
Test the network connectivity between Device A and Device C. If they cannot reach each other, locate the failed nodes in the network. Figure 3 Network diagram 1.1.1.1/24 1.1.1.2/24 Device A 1.1.2.1/24 1.1.2.2/24 Device B Device C Configuration procedure 1. Configure the IP addresses for devices as shown in Figure 3. 2. Configure a static route on Device A. system-view [DeviceA] ip route-static 0.0.0.0 0.0.0.0 1.1.1.2 [DeviceA] quit 3.
5. Use the debugging ip icmp command on Device A and Device C to verify that they can send and receive the specific ICMP packets. Or use the display ip routing-table command to verify that there is a route from Device A to Device C. System debugging The device supports debugging for the majority of protocols and features and provides debugging information to help users diagnose errors.
Debugging a feature module Output of debugging commands is memory intensive. To guarantee system performance, enable debugging only for modules that are in an exceptional condition. When debugging is complete, use the undo debugging all command to disable all the debugging functions. To debug a feature module: Step Command Remarks 1. Enable debugging for a specified module in user view. debugging { all [ timeout time ] | module-name [ option ] } By default, all debugging functions are disabled. 2.
Configuring NTP Synchronize your device with a trusted time source by using the Network Time Protocol (NTP) or changing the system time before you run it on a live network. Various tasks, including network management, charging, auditing, and distributed computing depend on an accurate system time setting, because the timestamps of system messages and logs use the system time. Overview NTP is typically used in large networks to dynamically synchronize time among network devices.
The synchronization process is as follows: 1. Device A sends Device B an NTP message, which is timestamped when it leaves Device A. The time stamp is 10:00:00 am (T1). 2. When this NTP message arrives at Device B, Device B adds a timestamp showing the time when the message arrived at Device B. The timestamp is 11:00:01 am (T2). 3. When the NTP message leaves Device B, Device B adds a timestamp showing the time when the message left Device B. The timestamp is 11:00:02 am (T3). 4.
To ensure time accuracy and availability, you can specify multiple NTP servers for a device. The device selects an optimal NTP server as the clock source based on parameters such as stratum. The clock that the device selects is called the reference source. For more information about clock selection, see the related protocols and standards.
Mode Working process Principle Application scenario A symmetric active peer and a symmetric passive peer can be synchronized to each other. If both of them are synchronized, the peer with a higher stratum is synchronized to the peer with a lower stratum. As Figure 6 shows, this mode is most often used between two or more servers with the same stratum to operate as a backup for one another.
NTP security To improve time synchronization security, NTP provides the access control and authentication functions. NTP access control You can control NTP access by using an ACL. The access rights are in the following order, from least restrictive to most restrictive: • Peer—Allows time requests and NTP control queries (such as alarms, authentication status, and time server information) and allows the local device to synchronize itself to a peer device.
in the NTP message. If they are the same, the receiver accepts the message. Otherwise, it discards the message. NTP for MPLS VPNs The device supports multiple VPN instances when it functions as an NTP client or a symmetric active peer to realize time synchronization with the NTP server or symmetric passive peer in an MPLS VPN network. Only the client/server and symmetric active/passive modes support VPN instances. For more information about MPLS L3VPN, VPN instance, and PE, see MPLS Configuration Guide.
• You can configure NTP only on one MDC. • The term "interface" in this chapter collectively refers to Layer 3 interfaces, including VLAN interfaces and Layer 3 Ethernet interfaces. You can set an Ethernet port as a Layer 3 interface by using the port link-mode route command (see Layer 2—LAN Switching Configuration Guide). Configuration task list Tasks at a glance (Required.) Enabling the NTP service (Required.
Step Enter system view. 1. Command Remarks system-view N/A • Specify an NTP server for the Specify an NTP server for the device. 2. device: ntp-service unicast-server { server-name | ip-address } [ vpn-instance vpn-instance-name ] [ authentication-keyid keyid | priority | source interface-type interface-number | version number ] * • Specify an IPv6 NTP server for By default, no NTP server is specified for the device.
Step Command Remarks • Specify a symmetric-passive 2. Specify a symmetric-passive peer for the device. peer: ntp-service unicast-peer { peer-name | ip-address } [ vpn-instance vpn-instance-name ] [ authentication-keyid keyid | priority | source interface-type interface-number | version number ] * • Specify an IPv6 By default, no symmetric-passive peer is specified.
Step 3. Command Configure the device to operate in NTP broadcast server mode. ntp-service broadcast-server [ authentication-keyid keyid | version number ] * Remarks By default, the device does not operate in broadcast server mode. After you execute the command, the device receives NTP broadcast messages from the specified interface.
Step Command Remarks • Configure the device to operate Configure the device to operate in multicast server mode. 3. in multicast server mode: ntp-service multicast-server [ ip-address ] [ authentication-keyid keyid | ttl ttl-number | version number ] * • Configure the device to operate in multicast server mode: ntp-service ipv6 multicast-server ipv6-multicast-address [ authentication-keyid keyid | ttl ttl-number ] * By default, the device does not operate in multicast server mode.
• Set the key as a trusted key on both client and server. • Associate the key with the NTP server on the client. The key IDs and key values configured on the server and client must be the same. Otherwise, NTP authentication fails. To configure NTP authentication for a client: Step Command Remarks 1. Enter system view. system-view N/A 2. Enable NTP authentication. ntp-service authentication enable By default, NTP authentication is disabled. 3. Configure an NTP authentication key.
Table 2 NTP authentication results Client Enable NTP authenticati on Yes Yes Yes Yes Yes No Server Configure a key and configure it as a trusted key Yes Yes Yes No N/A N/A Associate the key with an NTP server Yes Enable NTP authenticati on Yes Yes Yes Yes No Yes N/A No N/A N/A N/A Configure a key and configure it as a trusted key Authentication result Yes Succeeded. NTP messages can be sent and received correctly. No Failed. NTP messages cannot be sent and received correctly.
Step Command Remarks 1. Enter system view. system-view N/A 2. Enable NTP authentication. ntp-service authentication enable By default, NTP authentication is disabled. 3. Configure an NTP authentication key. ntp-service authentication-keyid keyid authentication-mode md5 { cipher | simple } value By default, no NTP authentication key is configured. 4. Configure the key as a trusted key.
Table 3 NTP authentication results Active peer Passive peer Enable NTP authentication Configure a key and configure it as a trusted key Associate the key with a passive peer Enable NTP authentication Configure a key and configure it as a trusted key Authentication result Stratum level of the active and passive peers is not considered. Yes Yes Yes Yes Yes Succeeded. NTP messages can be sent and received correctly. Yes Yes Yes Yes No Failed.
Configuring NTP authentication in broadcast mode When you configure NTP authentication in broadcast mode: • Enable NTP authentication. • Configure an authentication key. • Set the key as a trusted key on both the broadcast client and server. • Configure an NTP authentication key on the broadcast server. The key IDs and key values configured on the broadcast server and client must be the same. Otherwise, NTP authentication fails.
Table 4 NTP authentication results Broadcast server Broadcast client Enable NTP authentic ation Configure a key and configure it as a trusted key Associate the key with a broadcast server Enable NTP authenticati on Configure a key and configure it as a trusted key Yes Yes Yes Yes Yes Succeeded. NTP messages can be sent and received correctly. Yes Yes Yes Yes No Failed. NTP messages cannot be sent and received correctly. Yes Yes Yes No N/A Failed.
Step Command Remarks 2. Enable NTP authentication. ntp-service authentication enable By default, NTP authentication is disabled. 3. Configure an NTP authentication key. ntp-service authentication-keyid keyid authentication-mode md5 { cipher | simple } value By default, no NTP authentication key is configured. 4. Configure the key as a trusted key. ntp-service reliable authentication-keyid keyid By default, no authentication key is configured as a trusted key.
Multicast server Enable NTP authentic ation Yes Yes Yes Yes Yes Yes No No Configure a key and configure it as a trusted key Yes Yes No No N/A N/A N/A N/A Multicast client Associate the key with a multicast server Yes Enable NTP authenticatio n Yes Yes No Yes Yes Yes No No Yes No No N/A Yes N/A No Configure a key and configure it as a trusted key Authentication result No Failed. NTP messages cannot be sent and received correctly. N/A Failed.
address for the NTP messages to be sent. Set the loopback interface as the source interface so that any interface status change on the device will not cause NTP messages to be unable to be received. When the device responds to an NTP request, the source IP address of the NTP response is always the IP address of the interface that has received the NTP request.
Dynamic association—Temporary association created by the system during NTP operation. A dynamic association is removed if no messages are exchanged over a specific period of time. • The following describes how an association is established in different association modes: • Client/server mode—After you specify an NTP server, the system creates a static association on the client. The server simply responds passively upon the receipt of a message, rather than creating an association (static or dynamic).
Before you configure this feature, adjust the local system time to make sure it is accurate. • To configure the local clock as a reference source: Step Command Remarks 1. Enter system view. system-view N/A 2. Configure the local clock as a reference source. ntp-service refclock-master [ ip-address ] [ stratum ] By default, the device does not use the local clock as a reference source. Displaying and maintaining NTP Execute display commands in any view.
system-view [DeviceB] ntp-service enable # Specify Device A as the NTP server of Device B so that Device B is synchronized to Device A. [DeviceB] ntp-service unicast-server 1.0.1.11 4. Verify the configuration: # Display the NTP status of Device B after clock synchronization. [DeviceB] display ntp-service status Clock status: synchronized Clock stratum: 3 System peer: 1.0.1.11 Local mode: client Reference clock ID: 1.0.1.11 Leap indicator: 00 Clock jitter: 0.000977 s Stability: 0.
Configuration procedure 1. Set the IP address for each interface as shown in Figure 10. (Details not shown.) 2. Configure Device A: # Enable the NTP service. system-view [DeviceA] ntp-service enable # Specify the local clock as the reference source, with the stratum level 2. [DeviceA] ntp-service refclock-master 2 3. Configure Device B: # Enable the NTP service.
NTP symmetric active/passive mode configuration example Network requirements • As shown in Figure 11, Device C has a clock more accurate than Device A. Set the local clock of Device A as a reference source, with the stratum level 3. • Set the local clock Device C as a reference source, with the stratum level 2. • Configure Device B to operate in client mode and specify Device A as the NTP server of Device B.
# Specify the local clock as the reference source, with the stratum level 2. [DeviceC] ntp-service refclock-master 2 # Configure Device B as a symmetric passive peer. [DeviceC] ntp-service unicast-peer 3.0.1.32 5. Verify the configuration: # After the configuration, Device B has two time servers Device A and Device C. Device C has a lower stratum level than Device A, so Device B selects Device C as a reference clock to synchronize to Device C. After synchronization, view the status of Device B.
Figure 12 Network diagram Configuration procedure 1. Set the IP address for each interface as shown in Figure 12. (Details not shown.) 2. Configure Device A: # Enable the NTP service. system-view [DeviceA] ntp-service enable # Specify the local clock as the reference source, with the stratum level 3. [DeviceA] ntp-service refclock-master 3 3. Configure Device B: # Enable the NTP service.
Clock stratum: 3 System peer: 3000::36 Local mode: sym_passive Reference clock ID: 163.29.247.19 Leap indicator: 11 Clock jitter: 0.000977 s Stability: 0.000 pps Clock precision: 2^-10 Root delay: 0.01855 ms Root dispersion: 9.23483 ms Reference time: d0c6047c.97199f9f Wed, Dec 29 2010 19:03:24.590 # Display IPv6 NTP association information for Device B. [DeviceB] display ntp-service ipv6 sessions Notes: 1 source(master), 2 source(peer), 3 selected, 4 candidate, 5 configured.
Figure 13 Network diagram Configuration procedure 1. Set the IP address for each interface as shown in Figure 13. (Details not shown.) 2. Configure Switch C: # Enable the NTP service. system-view [SwitchC] ntp-service enable # Specify the local clock as the reference source, with the stratum level 2. [SwitchC] ntp-service refclock-master 2 # Configure Switch C to operate in broadcast server mode and send broadcast messages through VLAN-interface 2.
# Switch A and Switch B get synchronized upon receiving a broadcast message from Switch C. Display the NTP status of Switch A after clock synchronization. [SwitchA-Vlan-interface2] display ntp-service status Clock status: synchronized Clock stratum: 3 System peer: 3.0.1.31 Local mode: bclient Reference clock ID: 3.0.1.31 Leap indicator: 00 Clock jitter: 0.044281 s Stability: 0.000 pps Clock precision: 2^-10 Root delay: 0.00229 ms Root dispersion: 4.12572 ms Reference time: d0d289fe.
Figure 14 Network diagram Vlan-int2 3.0.1.31/24 Switch C NTP multicast server Vlan-int3 1.0.1.11/24 Vlan-int3 1.0.1.10/24 Switch A NTP multicast client Vlan-int2 3.0.1.30/24 Switch B Vlan-int2 3.0.1.32/24 Switch D NTP multicast client Configuration procedure 1. Set the IP address for each interface as shown in Figure 14. (Details not shown.) 2. Configure Switch C: # Enable the NTP service.
Leap indicator: 00 Clock jitter: 0.044281 s Stability: 0.000 pps Clock precision: 2^-10 Root delay: 0.00229 ms Root dispersion: 4.12572 ms Reference time: d0d289fe.ec43c720 Sat, Jan 8 2011 7:00:14.922 The output shows that Switch D has been synchronized to Switch C, the clock stratum level of Switch D is 3, and that of Switch C is 2. # Display IPv4 NTP association information for Switch D.
7. Verify the configuration: # Display the NTP status of Switch A after clock synchronization. [SwitchA-Vlan-interface3] display ntp-service status Clock status: synchronized Clock stratum: 3 System peer: 3.0.1.31 Local mode: bclient Reference clock ID: 3.0.1.31 Leap indicator: 00 Clock jitter: 0.165741 s Stability: 0.000 pps Clock precision: 2^-10 Root delay: 0.00534 ms Root dispersion: 4.51282 ms Reference time: d0c61289.10b1193f Wed, Dec 29 2010 20:03:21.
Figure 15 Network diagram Configuration procedure 1. Set the IP address for each interface as shown in Figure 15. (Details not shown.) 2. Configure Switch C: # Enable the NTP service. system-view [SwitchC] ntp-service enable # Specify the local clock as the reference source, with the stratum level 2. [SwitchC] ntp-service refclock-master 2 # Configure Switch C to operate in IPv6 multicast server mode and send multicast messages through VLAN-interface 2.
Leap indicator: 00 Clock jitter: 0.000977 s Stability: 0.000 pps Clock precision: 2^-10 Root delay: 0.00000 ms Root dispersion: 8.00578 ms Reference time: d0c60680.9754fb17 Wed, Dec 29 2010 19:12:00.591 The output shows that Switch D has been synchronized to Switch C, the clock stratum level of Switch D is 3, and that of Switch C is 2. # Display NTP association information for Switch D.
# Configure Switch A to operate in IPv6 multicast client mode and receive IPv6 multicast messages on VLAN-interface 3. [SwitchA] interface vlan-interface 3 [SwitchA-Vlan-interface3] ntp-service ipv6 multicast-client ff24::1 7. Verify the configuration: # Display the NTP status of Switch A after clock synchronization. [SwitchA-Vlan-interface3] display ntp-service status Clock status: synchronized Clock stratum: 3 System peer: 3000::2 Local mode: bclient Reference clock ID: 165.84.121.
Figure 16 Network diagram Configuration procedure 1. Set the IP address for each interface as shown in Figure 16. (Details not shown.) 2. Configure Device A: # Enable the NTP service. system-view [DeviceA] ntp-service enable # Specify the local clock as the reference source, with the stratum level 2. [DeviceA] ntp-service refclock-master 2 3. Configure Device B: # Enable the NTP service. system-view [DeviceB] ntp-service enable # Enable NTP authentication on Device B.
Reference clock ID: 1.0.1.11 Leap indicator: 00 Clock jitter: 0.005096 s Stability: 0.000 pps Clock precision: 2^-10 Root delay: 0.00655 ms Root dispersion: 1.15869 ms Reference time: d0c62687.ab1bba7d Wed, Dec 29 2010 21:28:39.668 The output shows that Device B has been synchronized to Device A, the clock stratum level of Device B is 3, and that of Device A is 2. # Display IPv4 NTP association information for Device B.
Figure 17 Network diagram Vlan-int2 3.0.1.31/24 Switch C NTP broadcast server Vlan-int2 3.0.1.30/24 Switch A NTP broadcast client Vlan-int2 3.0.1.32/24 Switch B NTP broadcast client Configuration procedure 1. Set the IP address for each interface as shown in Figure 17. (Details not shown.) 2. Configure Switch A: # Enable the NTP service. system-view [SwitchA] ntp-service enable # Enable NTP authentication on Switch A.
system-view [SwitchC] ntp-service enable # Specify the local clock as the reference source, with the stratum level 3. [SwitchC] ntp-service refclock-master 3 # Configure Switch C to operate in NTP broadcast server mode and use VLAN-interface 2 to send NTP broadcast packets. [SwitchC] interface vlan-interface 2 [SwitchC-Vlan-interface2] ntp-service broadcast-server [SwitchC-Vlan-interface2] quit 5.
source reference stra reach poll now offset delay disper ******************************************************************************** [1245]3.0.1.31 127.127.1.0 3 3 64 68 -0.0 0.0000 0.0 Notes: 1 source(master),2 source(peer),3 selected,4 candidate,5 configured. Total sessions : 1 The output shows that an association has been set up between Switch B and Switch C.
# Enable the NTP service. system-view [PE2] ntp-service enable # Specify CE 1 in VPN 1 as the NTP server of PE 2. [PE2] ntp-service unicast-server 10.1.1.1 vpn-instance vpn1 4. Verify the configuration: # Display the IPv4 NTP association information and status on PE 2 a certain period of time later. [PE2] display ntp-service status Clock status: synchronized Clock stratum: 3 System peer: 10.1.1.1 Local mode: client Reference clock ID: 10.1.1.1 Leap indicator: 00 Clock jitter: 0.
Figure 19 Network diagram Configuration procedure 1. Set the IP address for each interface as shown in Figure 19. (Details not shown.) 2. Configure CE 1: # Enable the NTP service. system-view [CE1] ntp-service enable # Specify the local clock as the reference source, with the stratum level 2. [CE1] ntp-service refclock-master 2 3. Configure PE 1: # Enable the NTP service. system-view [PE1] ntp-service enable # Specify CE 1 in VPN 1 as the symmetric-passive peer of PE 1.
[PE1] display ntp-service sessions source reference stra reach poll now offset delay disper ******************************************************************************** [1245]10.1.1.1 127.127.1.0 2 1 64 519 -0.0 0.0000 Notes: 1 source(master),2 source(peer),3 selected,4 candidate,5 configured. Total sessions : 1 [PE1] display ntp-service trace Server 127.0.0.1 Stratum 3 , jitter Server 10.1.1.1 Stratum 2 , jitter 939.00, synch distance 0.0000. RefID 127.127.1.0 0.
Configuring SNTP SNTP is a simplified, client-only version of NTP specified in RFC 4330. SNTP supports only the client/server mode. An SNTP-enabled device can receive time from NTP servers, but cannot provide time services to other devices. SNTP uses the same packet format and packet exchange procedure as NTP, but provides faster synchronization at the price of time accuracy. If you specify multiple NTP servers for an SNTP client, the server with the best stratum is selected.
Specifying an NTP server for the device Step Enter system view. 1. Command Remarks system-view N/A • For IPv4: Specify an NTP server for the device. 2.
Step Command Remarks 3. Configure an SNTP authentication key. sntp authentication-keyid keyid authentication-mode md5 { cipher | simple } value By default, no SNTP authentication key is configured. 4. Specify the key as a trusted key. sntp reliable authentication-keyid keyid By default, no trusted key is specified. • For IPv4: Associate the SNTP authentication key with the specific NTP server. 5.
[DeviceA] ntp-service enable # Configure the local clock of Device A as a reference source, with the stratum level 2. [DeviceA] ntp-service refclock-master 2 # Enable NTP authentication on Device A. [DeviceA] ntp-service authentication enable # Configure an NTP authentication key, with the key ID of 10 and key value of aNiceKey. Input the key in plain text. [DeviceA] ntp-service authentication-keyid 10 authentication-mode md5 simple aNiceKey # Specify the key as a trusted key.
Configuring the information center The information center on a device classifies and manages logs for all modules so that network administrators can monitor network performance and troubleshoot network problems. Overview The information center receives logs generated by source modules and outputs logs to different destinations according to user-defined output rules. You can classify, filter, and output logs based on source modules. To view the supported source modules, use info-center source ?.
Severity value Level Description 2 Critical Critical condition. For example, the device temperature exceeds the upper limit, the power module fails, or the fan tray fails. 3 Error Error condition. For example, the link state changes. 4 Warning Warning condition. For example, an interface is disconnected, or the memory resources are used up. 5 Notification Normal but significant condition. For example, a terminal logs in to the device, or the device reboots.
Default output rules for security logs Security logs can only be output to the security log file, and cannot be filtered by source modules and severity levels. Table 9 shows the default output rule for security logs.
Output destination Format Example • HP format: • HP format: Timestamp Sysname %%vvModule/Level/Mnemon ic: Source; Content • unicom format: Log host Timestamp Hostip vvModule/Level/Serial_number: Content • cmcc format: Timestamp Sysname %vvModule/Level/Mnemonic : Source Content <190>Nov 24 16:22:21 2010 HP %%10SYSLOG/6/SYSLOG_RE START: -DevIP=1.1.1.1; System restarted –HP Comware Software. • unicom format: <189>Oct 13 16:48:08 2000 10.1.1.
Field Description Indicates that the information was generated by an HP device. %% (vendor ID) This field exists only in logs sent to the log host. vv (version information) Identifies the version of the log, and has a value of 10. This field exists only in logs that are sent to the log host. Module Specifies the name of the module that generated the log. You can enter the info-center source ? command in system view to view the module list. Level Identifies the level of the log.
Timestamp parameters iso Description Example Timestamp format stipulated in ISO 8601. <189>2003-05-30T06:42:44 Sysname %%10FTPD/5/FTPD_LOGIN(l): User ftp (192.168.1.23) has logged in successfully. Only logs that are sent to a log host support this parameter. none no-year-date No timestamp is included. All logs support this parameter. Current date and time without year information, in the format of MMM DD hh:mm:ss:xxx. Only logs that are sent to a log host support this parameter.
Outputting logs to the console Step Command Remarks 1. Enter system view. system-view N/A 2. Enable the information center. info-center enable By default, the information center is enabled. 3. Configure an output rule for the console. info-center source { module-name | default } { console | monitor | logbuffer | logfile | loghost } { deny | level severity } For information about default output rules, see "Default output rules for logs." 4. (Optional.) Configure the timestamp format.
Step 8. (Optional.) Set the lowest level of logs that can be output to the monitor terminal. Command Remarks terminal logging level severity The default setting is 6 (informational). Outputting logs to a log host Step Command Remarks 1. Enter system view. system-view N/A 2. Enable the information center. info-center enable By default, the information center is enabled. 3. Configure an output rule for outputting logs to a log host.
Saving logs to the log file By default, the log file feature saves logs from the log file buffer to the log file every 24 hours. You can adjust the saving interval or manually save logs to the log file. After saving logs into the log file, the system clears the log file buffer. The log file has a maximum capacity. When the capacity is reached, the system will replace earliest logs with new logs. To save logs to the log file: Step Command Remarks 1. Enter system view. system-view N/A 2.
Managing security logs Security logs are very important for locating and troubleshooting network problems. Generally, security logs are output together with other logs. It is difficult to identify security logs among all logs. To solve this problem, you can save security logs into a security log file without affecting the current log output rules.
Task Command Remarks Display a summary of the security log file. display security-logfile summary Available in user view. By default, the security log file is saved in the seclog directory in the root directory of the storage device. Change the directory of the security log file. Manually save all the contents in the security log file buffer into the security log file. 1. system-view 2.
Step Command Remarks The default setting is flash:/diagfile. 5. (Optional.) Specify the directory to save the diagnostic log file. info-center diagnostic-logfile directory dir-name The configuration made by this command cannot survive a reboot or an active/standby switchover. (In standalone mode.) The configuration made by this command cannot survive an IRF reboot or a global active/standby switchover in an IRF fabric. (In IRF mode.) • Method 1: Configure the 6.
Step Enable synchronous information output. 2. Command Remarks info-center synchronous By default, synchronous information output is disabled. Enabling duplicate log suppression The output of consecutive duplicate logs at an interval of less than 30 seconds wastes system and network resources.
Step 3. Disable the interface from generating link up or link down logs. Command Remarks undo enable log updown By default, all interfaces generate link up and link down logs when the interface state changes. Displaying and maintaining information center Execute display commands in any view and reset commands in user view. Task Command Display the information of each output destination. display info-center Display the state and the log information of the log buffer (in standalone mode).
To avoid output of unnecessary information, disable all modules from outputting log information to the specified destination (console in this example) before you configure the output rule. # Configure an output rule to output to the console FTP logs that have a severity level of at least warning. [Sysname] info-center source ftp console level warning [Sysname] quit # Enable the display of logs on the console. (This function is enabled by default.
a. Log in to the log host as a root user. b. Create a subdirectory named Device in directory /var/log/, and then create file info.log in the Device directory to save logs from Device. # mkdir /var/log/Device # touch /var/log/Device/info.log c. Edit the file syslog.conf in directory /etc/ and add the following contents. # Device configuration messages local4.info /var/log/Device/info.log In this configuration, local4 is the name of the logging facility that the log host uses to receive logs.
# Enable the information center. system-view [Sysname] info-center enable # Specify the log host 1.2.0.1/16, and specify local5 as the logging facility. [Sysname] info-center loghost 1.2.0.1 facility local5 # Disable log output to the log host. [Sysname] info-center source default loghost deny To avoid outputting unnecessary information, disable all modules from outputting log information to the specified destination (loghost in this example) before you configure an output rule.
Configuring SNMP This chapter provides an overview of the Simple Network Management Protocol (SNMP) and guides you through the configuration procedure. Overview SNMP is an Internet standard protocol widely used for a management station to access and operate the devices on a network, regardless of their vendors, physical characteristics, and interconnect technologies.
Figure 26 MIB tree A MIB view represents a set of MIB objects (or MIB object hierarchies) with certain access privileges and is identified by a view name. The MIB objects included in the MIB view are accessible while those excluded from the MIB view are inaccessible. A MIB view can have multiple view records each identified by a view-name oid-tree pair. You control access to the MIB by assigning MIB views to SNMP groups or communities.
Configuring SNMPv1 or SNMPv2c basic parameters SNMPv1 and SNMPv2c settings are supported only in non-FIPS mode. To configure SNMPv1 or SNMPv2c basic parameters: Step 1. Enter system view. Command Remarks system-view N/A By default, the SNMP agent is disabled. The SNMP agent is enabled when you perform any command that begins with snmp-agent except for the snmp-agent calculate-password command. 2. (Optional.) Enable the SNMP agent. snmp-agent 3. (Optional.) Configure the system contact.
Step Command Remarks • (Method 1) Create an SNMP community: snmp-agent community { read | write } [ simple | cipher ] community-name [ mib-view view-name ] [ acl acl-number | acl ipv6 ipv6-acl-number ] * • (Method 2) Create an SNMPv1/v2c 8. Configure the SNMP access right. group, and add users to the group: a. snmp-agent group { v1 | v2c } group-name [ read-view view-name ] [ write-view view-name ] [ notify-view view-name ] [ acl acl-number | acl ipv6 ipv6-acl-number ] * Use either method.
Table 16 Basic security setting requirements for different security models Security model Authentication with privacy Security model keyword for the group Security key settings for the user Remarks privacy Authentication key, privacy key If the authentication key or the privacy key is not configured, SNMP communication will fail.
Step 8. Command (Optional.) Create or update a MIB view. snmp-agent mib-view { excluded | included } view-name oid-tree [ mask mask-value ] Remarks By default, the MIB view ViewDefault is predefined. In this view, all the MIB objects in the iso subtree but the snmpUsmMIB, snmpVacmMIB, and snmpModules.18 subtrees are accessible. Each view-name oid-tree pair represents a view record.
Step Command Remarks • In non-FIPS mode: 12. Create an SNMPv3 user.
Step Command Remarks 2. (Optional.) Enable SNMP logging. snmp-agent log { all | get-operation | set-operation } By default, SNMP logging is disabled. 3. (Optional.) Enable SNMP notification logging. snmp-agent trap log By default, SNMP notification logging is disabled. Configuring SNMP notifications The SNMP Agent sends notifications (traps and informs) to inform the NMS of significant events, such as link state changes and user logins or logouts.
Configuration guidelines When network congestion occurs or the destination is not reachable, the SNMP agent buffers notifications in a queue. You can configure the queue size and the notification lifetime (the maximum time that a notification can stay in the queue). A notification is deleted when its lifetime expires. When the notification queue is full, the oldest notifications are automatically deleted.
Step Command Remarks • (Method 1) Send traps to the target 2. Configure a target host.
Displaying the SNMP settings Execute display commands in any view. The display snmp-agent community command is supported only in non-FIPS mode. Task Command Display SNMP agent system information, including the contact, physical location, and SNMP version. display snmp-agent sys-info [ contact | location | version ] Display SNMP agent statistics. display snmp-agent statistics Display the local engine ID. display snmp-agent local-engineid Display SNMP group information.
Configuration procedure 1. Configure the SNMP agent: # Configure the IP address of the agent and make sure the agent and the NMS can reach each other. (Details not shown.) # Specify SNMPv1, and create the read-only community public and the read and write community private. system-view [Agent] snmp-agent sys-info version v1 [Agent] snmp-agent community read public [Agent] snmp-agent community write private # Configure contact and physical location information for the agent.
SpecificID = 0 Time Stamp = 8:35:25.68 SNMPv3 configuration example Network requirements As shown in Figure 28, the NMS (1.1.1.2/24) uses SNMPv3 to monitor and manage the interface status of the agent (1.1.1.1/24). The agent automatically sends notifications to report events to the NMS. The default UDP port 162 is used for SNMP notifications. The NMS and the agent perform authentication when they set up an SNMP session. The authentication algorithm is SHA-1 and the authentication key is 123456TESTauth&!.
{ Enable both authentication and privacy functions. { Use SHA-1 for authentication and AES for encryption. { Set the authentication key to 123456TESTauth&! and the privacy key to 123456TESTencr&!. { Set the timeout time and maximum number of retries. For information about configuring the NMS, see the NMS manual. NOTE: The SNMP settings on the agent and the NMS must match. 3. Verify the configuration: # Try to get the MTU value of NULL0 interface from the agent. The get attempt succeeds.
Configuring RMON Overview Remote Network Monitoring (RMON) is an enhancement to SNMP. It enables proactive remote monitoring and management of network devices and subnets. An RMON monitor periodically or continuously collects traffic statistics for the network attached to a port on the managed device. The managed device can automatically send a notification when a statistic crosses an alarm threshold, so the NMS does not need to constantly poll MIB variables and compare the results.
The history table stores traffic statistics collected for each sampling interval. Event group The event group controls the generation and notifications of events triggered by the alarms defined in the alarm group and the private alarm group. The following are RMON alarm event handling methods: • Log—Logs event information (including event time and description) in the event log table so the management device can get the logs through SNMP. • Trap—Sends an SNMP notification when the event occurs.
3. Compares the calculation result with the predefined thresholds, and then takes one of the following actions: { { Triggers the event associated with the rising alarm event if the result is equal to or greater than the rising threshold. Triggers the event associated with the falling alarm event if the result is equal to or less than the falling threshold. If a private alarm entry crosses a threshold multiple times in succession, the RMON agent generates an alarm event only for the first crossing.
Step Command Create an entry for the interface in the RMON statistics table. 3. Remarks By default, the RMON statistics table does not contain entries. rmon statistics entry-number [ owner text ] You can create one statistics entry for each Ethernet interface, and up to 100 statistics entries on the device. After the entry limit is reached, you cannot add new entries.
Entry Parameters to be compared Maximum number of entries Alarm variable (alarm-variable) Alarm • • • • • 60 • • • • • Alarm variable formula (prialarm-formula) Private alarm Sampling interval (sampling-interval) Sample type (absolute or delta) Rising threshold (threshold-value1) Falling threshold (threshold-value2) Sampling interval (sampling-interval) Sample type (absolute or delta) 50 Rising threshold (threshold-value1) Falling threshold (threshold-value2) To configure the RMON alarm functio
Task Command Display RMON private alarm entries. display rmon prialarm [ entry-number ] Display RMON event entries. display rmon event [ entry-number ] Display log information for event entries. display rmon eventlog [ entry-number ] Ethernet statistics group configuration example Network requirements Create an RMON Ethernet statistics entry on the device in Figure 30 to gather cumulative traffic statistics for Ten-GigabitEthernet 1/0/1.
History group configuration example Network requirements Create an RMON history control entry on the device in Figure 31 to sample traffic statistics for Ten-GigabitEthernet 1/0/1 every minute. Figure 31 Network diagram Configuration procedure # Create an RMON history control entry to sample traffic statistics every minute for Ten-GigabitEthernet 1/0/1. Retain up to eight samples for the interface in the history statistics table.
collisions : 0 , utilization : 0 dropevents : 0 , octets : 933 packets : 8 , broadcast packets : 0 Sampling record 4 : multicast packets : 7 , CRC alignment errors : 0 undersize packets : 0 , oversize packets : 0 fragments : 0 , jabbers : 0 collisions : 0 , utilization : 0 dropevents : 0 , octets : 898 packets : 9 , broadcast packets : 2 Sampling record 5 : multicast packets : 6 , CRC alignment errors : 0 undersize packets : 0 , oversize packets : 0 fragments : 0 ,
Figure 32 Network diagram Configuration procedure # Configure the SNMP agent (the device) with the same SNMP settings as the NMS at 1.1.1.2. This example uses SNMPv1, read community public, and write community private.
EtherStatsEntry 1 owned by user1 is VALID. Interface : Ten-GigabitEthernet1/0/1
Configuring NQA Overview Network quality analyzer (NQA) allows you to measure network performance, verify the service levels for IP services and applications, and troubleshoot network problems.
• A UDP jitter or a voice operation sends a specific number of probe packets. The number of probe packets is configurable with the probe packet-number command. • An FTP, HTTP, DHCP, or DNS operation uploads or downloads a file, gets a web page, gets an IP address through DHCP, or translates a domain name to an IP address. • An ICMP echo or UDP echo operation sends an ICMP echo request or a UDP packet. • An SNMP operation sends one SNMPv1 packet, one SNMPv2c packet, and one SNMPv3 packet.
Table 18 Performance metrics and NQA operation types Performance metric NQA operation types that can gather the metric Probe duration All NQA operation types excluding UDP jitter, path jitter, and voice Number of probe failures All NQA operation types excluding UDP jitter, path jitter, and voice Round-trip time UDP jitter and voice Number of discarded packets UDP jitter and voice One-way jitter (source-to-destination and destination-to-source) UDP jitter and voice One-way latency (source-to-dest
Step Enable the NQA server. 2. Command Remarks nqa server enable By default, the NQA server is disabled. • TCP listening service: Configure a TCP or UDP listening service. 3. nqa server tcp-connect ip-address port-number [ tos tos ] [ vpn-instance vpn-instance-name ] • UDP listening service: nqa server udp-echo ip-address port-number [ tos tos ] [ vpn-instance vpn-instance-name ] You can specify the ToS value in the IP packet header of NQA probe packets. The default ToS value is 0.
Configuring the ICMP echo operation The ICMP echo operation measures the reachability of a destination device. It has the same function as the ping command, but provides more output information. In addition, if multiple paths exist between the source and destination devices, you can specify the next hop for the ICMP echo operation. The ICMP echo operation is not supported in IPv6 networks. To test the reachability of an IPv6 address, use the ping ipv6 command.
The NQA client simulates the DHCP relay agent to forward DHCP requests for IP address acquisition from the DHCP server. The interface that performs the DHCP operation does not change its IP address. When the DHCP operation completes, the NQA client sends a packet to release the obtained IP address. To configure the DHCP operation: Step Command Remarks 1. Enter system view. system-view N/A 2. Create an NQA operation and enter NQA operation view.
Configuring the FTP operation The FTP operation measures the time for the NQA client to transfer a file to or download a file from an FTP server. Follow these guidelines when you configure the FTP operation: • When you perform the put operation with the filename command configured, make sure the file exists on the NQA client. • If you get a file from the FTP server, make sure the file specified in the URL exists on the FTP server. • The NQA client does not save the file obtained from the FTP server.
Configuring the HTTP operation An HTTP operation measures the time for the NQA client to obtain data from an HTTP server. To configure an HTTP operation: Step Command Remarks 1. Enter system view. system-view N/A 2. Create an NQA operation and enter NQA operation view. nqa entry admin-name operation-tag By default, no NQA operation is created. Specify the HTTP type and enter its view. type http N/A 3. 4. Specify the URL of the destination HTTP server.
Configuring the UDP jitter operation CAUTION: To ensure successful UDP jitter operations and avoid affecting existing services, do not perform the operations on well-known ports from 1 to 1023. Jitter means inter-packet delay variance. A UDP jitter operation measures unidirectional and bidirectional jitters so that you can verify whether the network can carry jitter-sensitive services such as real-time voice and video services. The UDP jitter operation works as follows: 1.
Step 9. Command Specify the number of UDP packets sent in one UDP jitter operation. probe packet-number packet-number Remarks The default setting is 10. 10. Configure the interval for sending UDP packets. probe packet-interval packet-interval The default setting is 20 milliseconds. 11. Specify how long the NQA client waits for a response from the server before it regards the response times out. probe packet-timeout packet-timeout The default setting is 3000 milliseconds.
Configuring the TCP operation The TCP operation measures the time for the NQA client to establish a TCP connection to a specific port on the NQA server. The TCP operation requires both the NQA server and the NQA client. Before you perform a TCP operation, configure a TCP listening service on the NQA server. For more information about the TCP listening service configuration, see "Configuring the NQA server." To configure the TCP operation: Step Command Remarks 1. Enter system view. system-view N/A 2.
Step Command Remarks 2. Create an NQA operation and enter NQA operation view. nqa entry admin-name operation-tag By default, no NQA operation is created. 3. Specify the UDP echo type and enter its view. type udp-echo N/A By default, no destination IP address is specified. 4. Specify the destination address of UDP packets. destination ip ip-address The destination address must be the same as the IP address of the listening service configured on the NQA server.
The following parameters that reflect VoIP network performance can be calculated by using the metrics gathered by the voice operation: • Calculated Planning Impairment Factor (ICPIF)—Measures impairment to voice quality in a VoIP network. It is decided by packet loss and delay. A higher value represents a lower service quality. • Mean Opinion Scores (MOS)—A MOS value can be evaluated by using the ICPIF value, in the range of 1 to 5. A higher value represents a higher service quality.
Step Command Remarks 10. Specify the payload size in each voice packet. data-size size By default, the voice packet size depends on the codec type. The default packet size is 172 bytes for G.711A-law and G.711 μ-law codec type, and 32 bytes for G.729 A-law codec type. 11. Specify the string to be filled in the payload of each voice packet. data-fill string The default setting is the hexadecimal number 00010203040506070809. 12. Specify the number of voice packets to be sent in a voice probe.
Configuring the path jitter operation The path jitter operation measures the jitter, negative jitters, and positive jitters from the NQA client to each hop on the path to the destination. Before you configure the path jitter operation, perform the following configurations: • Enable sending ICMP time-exceeded packets on the intermediate devices between the source and the destination devices. If the intermediate devices are HP devices, use the ip ttl-expires enable command.
Step Command Remarks 12. (Optional.) Perform the path jitter operation on destination only. target-only By default, the path jitter operation is performed on each hop on the path to the destination. Configuring optional parameters for the NQA operation Unless otherwise specified, the following optional parameters apply to all types of NQA operations. To configure optional parameters for an NQA operation: Step Command Remarks 1. Enter system view. system-view N/A 2.
Step Command Remarks 10. (Optional.) Enable the routing table bypass function. route-option bypass-route 11. (Optional.) Specify the VPN where the operation is performed. vpn-instance vpn-instance-name By default, the routing table bypass function is disabled. This command is not available for the DHCP and path jitter operations. By default, the operation is performed on the public network.
consecutive—If the number of consecutive times that the monitored performance metric is out of the specified value range reaches or exceeds the specified threshold, a threshold violation occurs. • Threshold violations for the average or accumulate threshold type are determined on a per NQA operation basis, and threshold violations for the consecutive type are determined from the time the NQA operation starts.
Step Command Remarks • Monitor the operation duration (not supported in the UDP jitter and voice operations): reaction item-number checked-element probe-duration threshold-type { accumulate accumulate-occurrences | average | consecutive consecutive-occurrences } threshold-value upper-threshold lower-threshold [ action-type { none | trap-only } ] • Monitor failure times (not supported in the UDP jitter and voice operations): reaction item-number checked-element probe-fail threshold-type { accumulate acc
Configuring the NQA statistics collection function NQA collects statistics for operations completed within a specific period. The statistics forms a statistics group. A statistics group is generated after an operation is completed. To view information about the statistics groups, use the display nqa statistics command. A statistics group is deleted when its hold time expires. When the maximum number of statistics groups is reached, to save a new statistics group, the oldest statistics group is deleted.
Step Command Remarks Create an NQA operation and enter NQA operation view. nqa entry admin-name operation-tag By default, no NQA operation is created. 3. Enter NQA operation type view. type { dhcp | dlsw | dns | ftp | http | icmp-echo | snmp | tcp | udp-echo } The UDP jitter, path jitter, and voice operations do not support the saving of history records function. 4. Enable the saving of history records for the NQA operation. history-record enable By default, this feature is not enabled.
Configuring the ICMP template A feature that uses the ICMP template creates and starts the ICMP operation to measure the reachability of a destination device. The ICMP template is supported in both IPv4 and IPv6 networks. To configure the ICMP template: Step Command Remarks 1. Enter system view. system-view N/A 2. Create an ICMP template and enter its view. nqa template icmp name N/A 3. (Optional.) Specify the destination IPv4 or IPv6 address of the operation.
Step 2. Create a DNS template and enter DNS template view. 3. (Optional.) Specify the DNS server's IPv4 or IPv6 address. Command Remarks nqa template dns name N/A • IPv4 address: destination ip ip-address • IPv6 address: By default, the IP address of the DNS server is not specified. destination ipv6 ipv6-address 4. Configure the destination port number for the operation. destination port port-number By default, the destination port number is 53. 5.
Step 4. 5. 6. Command By default, no destination port number is configured. (Optional.) Configure the destination port number for the operation. destination port port-number Specify the string to be filled in the payload of each request. data-fill string (Optional.) Configure the expected data. Remarks The destination port number must be the same as the port number of the listening service on the NQA server. The default setting is the hexadecimal number 00010203040506070809.
Step 5. Specify an HTTP login password. Command Remarks password { cipher | simple } password By default, no HTTP login password is specified. By default, the HTTP operation type is get, which means obtaining data from the HTTP server. 6. Specify the HTTP operation type. operation { get | post | raw } In the HTTP raw operation, use the raw-request command to specify the content of the GET request to be sent to the HTTP server. This step is required for the raw operation. 7. (Optional.
Step Command Remarks 5. Specify an FTP login username. username username By default, no FTP login username is specified. 6. Specify an FTP login password. password { cipher | simple } password By default, no FTP login password is specified. 7. (Optional.) Specify the name of a file to be transferred. filename filename Set the data transmission mode. mode { active | passive } 8. This step is required if you perform the put operation. By default, no file is specified.
Step 11. Configure the source IPv4 or IPv6 address for probe packets. Command Remarks • IPv4 address: By default, no source IP address is configured. source ip ip-address • IPv6 address: source ipv6 ipv6-address The specified source IP address must be the IP address of a local interface, and the interface must be up. Otherwise, no probe packets can be sent out. Displaying and maintaining NQA Execute display commands in any view. Task Command Display history records of NQA operations.
NQA configuration examples ICMP echo operation configuration example Network requirements As shown in Figure 35, configure and schedule an ICMP echo operation from the NQA client Device A to Device B through Device C to test the round-trip time. Figure 35 Network diagram Device C 10.1.1.2/24 10.2.2.1/24 NQA client 10.1.1.1/24 10.2.2.2/24 10.3.1.1/24 10.4.1.2/24 Device A Device B 10.3.1.2/24 10.4.1.1/24 Device D Configuration procedure # Assign each interface an IP address. (Details not shown.
# Enable saving history records and configure the maximum number of history records that can be saved as 10. [DeviceA-nqa-admin-test1-icmp-echo] history-record enable [DeviceA-nqa-admin-test1-icmp-echo] history-record number 10 [DeviceA-nqa-admin-test1-icmp-echo] quit # Start the ICMP echo operation. [DeviceA] nqa schedule admin test1 start-time now lifetime forever # After the ICMP echo operation runs for a period of time, stop the operation.
Figure 36 Network diagram Configuration procedure # Create a DHCP operation to be performed to the destination IP address 10.1.1.2. system-view [SwitchA] nqa entry admin test1 [SwitchA-nqa-admin-test1] type dhcp [SwitchA-nqa-admin-test1-dhcp] destination ip 10.1.1.2 # Enable the saving of history records. [SwitchA-nqa-admin-test1-dhcp] history-record enable [SwitchA-nqa-admin-test1-dhcp] quit # Start the DHCP operation.
Figure 37 Network diagram Configuration procedure # Assign each interface an IP address. (Details not shown.) # Configure static routes or a routing protocol to make sure the devices can reach each other. (Details not shown.) # Create a DNS operation. system-view [DeviceA] nqa entry admin test1 [DeviceA-nqa-admin-test1] type dns # Specify the IP address of the DNS server 10.2.2.2 as the destination address and specify the domain name to be translated as host.com.
FTP operation configuration example Network requirements As shown in Figure 38, configure an FTP operation to test the time required for Device A to upload a file to the FTP server. The login username is admin, the login password is systemtest, and the file to be transferred to the FTP server is config.txt. Figure 38 Network diagram Configuration procedure # Assign each interface an IP address. (Details not shown.
Min/Max/Average round trip time: 173/173/173 Square-Sum of round trip time: 29929 Last succeeded probe time: 2011-11-22 10:07:28.6 Extended results: Packet loss ratio: 0% Failures due to timeout: 0 Failures due to disconnect: 0 Failures due to no connection: 0 Failures due to internal error: 0 Failures due to other errors: 0 # Display the history records of the FTP operation.
# Enable the saving of history records. [DeviceA-nqa-admin-test1-http] history-record enable [DeviceA-nqa-admin-test1-http] quit # Start the HTTP operation. [DeviceA] nqa schedule admin test1 start-time now lifetime forever # After the HTTP operation runs for a period of time, stop the operation. [DeviceA] undo nqa schedule admin test1 # Display the most recent results of the HTTP operation.
# Enable the NQA server and configure a listening service to listen on the IP address 10.2.2.2 and UDP port 9000. system-view [DeviceB] nqa server enable [DeviceB] nqa server udp-echo 10.2.2.2 9000 4. Configure Device A: # Create a UDP jitter operation. system-view [DeviceA] nqa entry admin test1 [DeviceA-nqa-admin-test1] type udp-jitter # Configure 10.2.2.2 as the destination IP address and port 9000 as the destination port. [DeviceA-nqa-admin-test1-udp-jitter] destination ip 10.2.2.
Negative SD square-sum: 460 Negative DS square-sum: 754 One way results: Max SD delay: 15 Max DS delay: 16 Min SD delay: 7 Min DS delay: 7 Number of SD delay: 10 Number of DS delay: 10 Sum of SD delay: 78 Sum of DS delay: 85 Square-Sum of SD delay: 666 Square-Sum of DS delay: 787 SD lost packets: 0 DS lost packets: 0 Lost packets for unknown reason: 0 # Display the statistics of the UDP jitter operation.
SNMP operation configuration example Network requirements As shown in Figure 41, configure an SNMP operation to test the time the NQA client uses to get a value from the SNMP agent. Figure 41 Network diagram Configuration procedure 1. Assign each interface an IP address. (Details not shown.) 2. Configure static routes or a routing protocol to make sure the devices can reach each other. (Details not shown.) 3.
Failures due to timeout: 0 Failures due to internal error: 0 Failures due to other errors: 0 # Display the history records of the SNMP operation. [DeviceA] display nqa history admin test1 NQA entry (admin admin, tag test1) history records: Index Response Status Time 1 50 Succeeded 2011-11-22 10:24:41.1 The output shows that Device A uses 50 milliseconds to receive a response from the SNMP agent.
# After the TCP operation runs for a period of time, stop the operation. [DeviceA] undo nqa schedule admin test1 # Display the most recent results of the TCP operation. [DeviceA] display nqa result admin test1 NQA entry (admin admin, tag test1) test results: Send operation times: 1 Receive response times: 1 Min/Max/Average round trip time: 13/13/13 Square-Sum of round trip time: 169 Last succeeded probe time: 2011-11-22 10:27:25.
4. Configure Device A: # Create a UDP echo operation. system-view [DeviceA] nqa entry admin test1 [DeviceA-nqa-admin-test1] type udp-echo # Configure 10.2.2.2 as the destination IP address and port 8000 as the destination port. [DeviceA-nqa-admin-test1-udp-echo] destination ip 10.2.2.2 [DeviceA-nqa-admin-test1-udp-echo] destination port 8000 # Enable the saving of history records.
Configuration procedure 1. Assign each interface an IP address. (Details not shown.) 2. Configure static routes or a routing protocol to make sure the devices can reach each other. (Details not shown.) 3. Configure Device B: # Enable the NQA server, and configure a listening service to listen on IP address 10.2.2.2 and UDP port 9000. system-view [DeviceB] nqa server enable [DeviceB] nqa server udp-echo 10.2.2.2 9000 4. Configure Device A: # Create a voice operation.
Max negative SD: 203 Max negative DS: 1297 Negative SD number: 255 Negative DS number: 259 Negative SD sum: 759 Negative DS sum: 1796 Negative SD average: 2 Negative DS average: 6 Negative SD square-sum: 53655 Negative DS square-sum: 1691776 One way results: Max SD delay: 343 Max DS delay: 985 Min SD delay: 343 Min DS delay: 985 Number of SD delay: 1 Number of DS delay: 1 Sum of SD delay: 343 Sum of DS delay: 985 Square-Sum of SD delay: 117649 SD lost packets: 0 Square-Sum of DS delay: 97
Min SD delay: 0 Min DS delay: 0 Number of SD delay: 4 Number of DS delay: 4 Sum of SD delay: 1390 Sum of DS delay: 1079 Square-Sum of SD delay: 483202 Square-Sum of DS delay: 973651 SD lost packets: 0 DS lost packets: 0 Lost packets for unknown reason: 0 Voice scores: Max MOS value: 4.38 Min MOS value: 4.
Packet loss ratio: 0% Failures due to timeout: 0 Failures due to disconnect: 0 Failures due to no connection: 0 Failures due to internal error: 0 Failures due to other errors: 0 # Display the history records of the DLSw operation. [DeviceA] display nqa history admin test1 NQA entry (admin admin, tag test1) history records: Index Response Status Time 1 19 Succeeded 2011-11-22 10:40:27.7 The output shows that the response time of the DLSw device is 19 milliseconds.
[DeviceA] display nqa result admin test1 NQA entry (admin admin, tag test1) test results: Hop IP 10.1.1.
NQA collaboration configuration example Network requirements As shown in Figure 47, configure a static route to Switch C with Switch B as the next hop on Switch A. Associate the static route, a track entry, and an ICMP operation to monitor the state of the static route. Figure 47 Network diagram Configuration procedure 1. Assign each interface an IP address. (Details not shown.) 2.
Verifying the configuration # On Switch A, display information about all the track entries. [SwitchA] display track all Track ID: 1 State: Positive Duration: 0 days 0 hours 0 minutes 0 seconds Notification delay: Positive 0, Negative 0 (in seconds) Tracked object: NQA entry: admin test1 Reaction: 1 # Display brief information about active routes in the routing table on Switch A. [SwitchA] display ip routing-table Destinations : 13 Routes : 13 Destination/Mask Proto 0.0.0.0/32 10.1.1.
Destinations : 12 Routes : 12 Destination/Mask Proto 0.0.0.0/32 10.2.1.0/24 Pre Cost NextHop Interface Direct 0 0 127.0.0.1 InLoop0 Direct 0 0 10.2.1.2 Vlan3 10.2.1.0/32 Direct 0 0 10.2.1.2 Vlan3 10.2.1.2/32 Direct 0 0 127.0.0.1 InLoop0 10.2.1.255/32 Direct 0 0 10.2.1.2 Vlan3 127.0.0.0/8 Direct 0 0 127.0.0.1 InLoop0 127.0.0.0/32 Direct 0 0 127.0.0.1 InLoop0 127.0.0.1/32 Direct 0 0 127.0.0.1 InLoop0 127.255.255.255/32 Direct 0 0 127.0.0.1 InLoop0 224.0.0.
# Configure static routes or a routing protocol to make sure the devices can reach each other. (Details not shown.) # Create ICMP template icmp and specify 10.2.2.2 as the destination IP address. system-view [DeviceA] nqa template icmp icmp [DeviceA-nqatplt-icmp-icmp] destination ip 10.2.2.2 # Set the probe timeout time for the ICMP operation to 500 milliseconds, and configure the operation to repeat at an interval of 3000 milliseconds.
[DeviceA-nqatplt-dns-dns] reaction trigger probe-fail 2 TCP template configuration example Network requirements As shown in Figure 50, configure a TCP template for a feature to perform the TCP operation to test whether Device A can establish a TCP connection to Device B and process the server's response. Figure 50 Network diagram Configuration procedure 1. Assign each interface an IP address. (Details not shown.) 2.
Figure 51 Network diagram Configuration procedure # Assign each interface an IP address. (Details not shown.) # Configure static routes or a routing protocol to make sure the devices can reach each other. (Details not shown.) # Create HTTP template http. system-view [DeviceA] nqa template http http # Specify the URL of the server. [DeviceA-nqatplt-http-http] url http://10.2.2.2/index.htm # Configure the HTTP operation to get data from the HTTP server.
# Specify the URL of the FTP server. [DeviceA-nqatplt-ftp-ftp] url ftp://10.2.2.2 # Specify 10.1.1.1 as the source IP address. [DeviceA-nqatplt-ftp-ftp] source ip 10.1.1.1 # Configure the device to upload file config.txt to the FTP server. [DeviceA-nqatplt-ftp-ftp] operation put [DeviceA-nqatplt-ftp-ftp] filename config.txt # Specify the username for the FTP server login as admin. [DeviceA-nqatplt-ftp-ftp] username admin # Specify the password for the FTP server login as systemtest.
Configuring port mirroring The port mirroring feature is available on both Layer 2 and Layer 3 Ethernet interfaces. The term "interface" in this chapter collectively refers to these two types of interfaces. You can use the port link-mode command to configure an Ethernet port as a Layer 2 or Layer 3 interface (see Layer 2—LAN Switching Configuration Guide).
Reflector port, egress port, and remote probe VLAN A reflector port, remote probe VLAN, and an egress port are used for Layer 2 remote port mirroring. The remote probe VLAN specially transmits mirrored packets to the destination device. Both the reflector port and egress port reside on a source device and send mirrored packets to the remote probe VLAN.
Remote port mirroring In remote port mirroring, the source device is not directly connected to the data monitoring device but copies mirrored packets to the destination device, which forwards them to the data monitoring device. The mirroring source and the mirroring destination reside on different devices and in different mirroring groups. The mirroring group that contains the mirroring source or the mirroring destination is called a "remote source group" or "remote destination group", respectively.
The source device sends one copy of packets received on the source port Ten-GigabitEthernet 1/0/1 to the tunnel interface (serving as the monitor port in the local mirroring group created on the source device), which then forwards them to the tunnel interface on the destination device through the GRE tunnel.
Configuring source ports for the local mirroring group You can configure a list of source ports for a mirroring group in system view, or assign a port to it as a source port in interface view. To assign multiple ports to the mirroring group as source ports in interface view, repeat the operation. Configuration restrictions and guidelines When you configure source ports for a local mirroring group, follow these restrictions and guidelines: • A mirroring group can contain multiple source ports.
Step Command Remarks • In standalone mode: Configure source CPUs for the specified local mirroring group. 2. mirroring-group group-id mirroring-cpu slot slot-number-list { both | inbound | outbound } • In IRF mode: mirroring-group group-id mirroring-cpu chassis chassis-number slot slot-number-list { both | inbound | outbound } By default, no source CPU is configured for a local mirroring group.
Step Command Remarks 1. Enter system view. system-view N/A 2. Enter interface view. interface interface-type interface-number N/A 3. Configure the port as the monitor port for the specified mirroring group. mirroring-group group-id monitor-port By default, a port does not serve as the monitor port for any local mirroring group.
• A remote probe VLAN must be a static VLAN. To remove the VLAN configured as a remote probe VLAN, you must first remove the remote probe VLAN with the undo mirroring-group remote-probe vlan command. • If the remote probe VLAN of a remote mirroring group is removed, the remote mirroring group will become invalid. Configuration procedure To configure local port mirroring with multiple monitor ports: Step 1. Enter system view. 2. Create a remote source group.
HP recommends that you configure the destination device first, then the intermediate devices, and then the source device. Layer 2 remote port mirroring configuration task list Tasks at a glance (Required.) Configuring a remote destination group on the destination device: 1. Creating a remote destination group 2. Configuring the monitor port for a remote destination group 3. Configuring the remote probe VLAN for a remote destination group 4.
Directly connect the monitor port for local port mirroring in source CPU mode to the data monitoring device. Disable these functions on the monitor port: • { 802.1X. { IGMP snooping. { MAC address learning. { Spanning tree feature. { Static ARP. To configure the monitor port for a remote destination group in system view: Step Command Remarks 1. Enter system view. system-view N/A 2. Configure the monitor port for the specified remote destination group.
Assigning the monitor port to the remote probe VLAN Step Command 1. Enter system view. system-view 2. Enter the interface view of the monitor port. interface interface-type interface-number • For an access port: port access vlan vlan-id • For a trunk port: Assign the port to the probe VLAN. 3.
Step Command Remarks 1. Enter system view. system-view N/A 2. Enter interface view. interface interface-type interface-number N/A 3. Configure the port as a source port for the specified remote source group. mirroring-group group-id mirroring-port { both | inbound | outbound } By default, a port does not serve as a source port for any remote source group. Configuring source CPUs for a remote source group A mirroring group can contain multiple source CPUs.
Step Command Remarks 1. Enter system view. system-view N/A 2. Enter interface view. interface interface-type interface-number N/A 3. Configure the port as the egress port for the specified remote source group. mirroring-group group-id monitor-egress By default, a port does not serve as the egress port for any remote source group. Configuring the remote probe VLAN for a remote source group You must first create a static VLAN before you configure it as a remote probe VLAN.
Tasks at a glance Configuring local mirroring groups 1. Perform at least one of the following tasks: 2. { { Configuring source ports for a local mirroring group Configuring source CPUs for a local mirroring group Configuring the monitor port for a local mirroring group 3. (Required.) Configuring the destination device: 1. Configuring local mirroring groups 2. Configuring source ports for a local mirroring group 3.
Configuration procedure To configure source ports in system view: Step Command Remarks 1. Enter system view. system-view N/A 2. Configure source ports for the specified local mirroring group. mirroring-group group-id mirroring-port interface-list { both | inbound | outbound } By default, no source port is configured for a local mirroring group. To configure source ports in interface view: Step Command Remarks 1. Enter system view. system-view N/A 2. Enter interface view.
Configuring the monitor port for a local mirroring group On the source device, configure the tunnel interface as the monitor port. On the destination device, configure the port that connects the data monitoring device as the monitor port. You can configure the monitor port for a mirroring group in system view, or assign a port to a mirroring group as the monitor port in interface view. The two modes lead to the same result.
Port mirroring configuration examples Local port mirroring configuration example (in source port mode) Network requirements As shown in Figure 56, configure local port mirroring in source port mode to enable the server to monitor the bidirectional traffic of the marketing department and the technical department. Figure 56 Network diagram Configuration procedure # Create local mirroring group 1.
Ten-GigabitEthernet1/0/1 Both Ten-GigabitEthernet1/0/2 Both Monitor port: Ten-GigabitEthernet1/0/3 Local port mirroring configuration example (in source CPU mode) Network requirements As shown in Figure 57, Ten-GigabitEthernet 1/0/1 and Ten-GigabitEthernet 1/0/2 are located on the card in slot 1.
Mirroring group 1: Type: Local Status: Active Mirroring CPU: Slot 1 Both Monitor port: Ten-GigabitEthernet1/0/3 Local port mirroring with multiple monitor ports configuration example Network requirements As shown in Figure 58, Dept. A, Dept. B, and Dept. C are connected to Device A through ports Ten-GigabitEthernet 1/0/1, Ten-GigabitEthernet 1/0/2, and Ten-GigabitEthernet 1/0/3, respectively.
[DeviceA] vlan 10 [DeviceA-vlan10] port ten-gigabitethernet 1/0/11 to ten-gigabitethernet 1/0/13 [DeviceA-vlan10] quit # Configure VLAN 10 as the remote probe VLAN of remote source group 1. [DeviceA] mirroring-group 1 remote-probe vlan 10 Layer 2 remote port mirroring configuration example Network requirements On the Layer 2 network shown in Figure 59, configure Layer 2 remote port mirroring to enable the server to monitor the bidirectional traffic of the marketing department.
[DeviceC] interface ten-gigabitethernet 1/0/2 [DeviceC-Ten-GigabitEthernet1/0/2] mirroring-group 2 monitor-port [DeviceC-Ten-GigabitEthernet1/0/2] undo stp enable [DeviceC-Ten-GigabitEthernet1/0/2] port access vlan 2 [DeviceC-Ten-GigabitEthernet1/0/2] quit 2. Configure Device B (the intermediate device): # Create VLAN 2, which is to be configured as the remote probe VLAN. system-view [DeviceB] vlan 2 # Disable MAC address learning for VLAN 2.
Verifying the configuration # Display information about all mirroring groups on Device C. [DeviceC] display mirroring-group all Mirroring group 2: Type: Remote destination Status: Active Monitor port: Ten-GigabitEthernet1/0/2 Remote probe VLAN: 2 # Display information about all mirroring groups on Device A.
# Assign Ten-GigabitEthernet 1/0/3 to service loopback group 1. [DeviceA] interface ten-gigabitethernet 1/0/3 [DeviceA-Ten-GigabitEthernet1/0/3] port service-loopback group 1 All configurations on the interface will be lost. Continue?[Y/N]:y [DeviceA-Ten-GigabitEthernet1/0/3] quit # Create tunnel interface Tunnel 0 that operates in GRE mode, and configure an IP address and subnet mask for the interface. [DeviceA] interface tunnel 0 mode gre [DeviceA-Tunnel0] ip address 50.1.1.
[DeviceC] interface tunnel 0 [DeviceC-Tunnel0] ip address 50.1.1.2 24 # Configure source and destination IP addresses for Tunnel 0. [DeviceC-Tunnel0] tunnel-protocol gre [DeviceC-Tunnel0] source 30.1.1.2 [DeviceC-Tunnel0] destination 20.1.1.1 [DeviceC-Tunnel0] quit # Enable the OSPF protocol. [DeviceC] ospf 1 [DeviceC-ospf-1] area 0 [DeviceC-ospf-1-area-0.0.0.0] network 30.1.1.0 0.0.0.255 [DeviceC-ospf-1-area-0.0.0.0] network 40.1.1.0 0.0.0.255 [DeviceC-ospf-1-area-0.0.0.
Configuring traffic mirroring The traffic mirroring feature is available on both Layer 2 and Layer 3 Ethernet interfaces. The term "interface" in this chapter collectively refers to these two types of interfaces. You can use the port link-mode command to configure an Ethernet port as a Layer 2 or Layer 3 interface (see Layer 2—LAN Switching Configuration Guide).
Local traffic mirroring configuration task list Tasks at a glance (Required.) Configuring match criteria (Required.) Configuring a traffic behavior (Required.) Configuring a QoS policy (Required.) Applying a QoS policy: • • • • Applying a QoS policy to an interface Applying a QoS policy to a VLAN Applying a QoS policy globally Applying a QoS policy to the control plane Configuring match criteria Step Command Remarks 1. Enter system view. system-view N/A 2. Create a class and enter class view.
Configuring a QoS policy Step Command Remarks 1. Enter system view. system-view N/A 2. Create a QoS policy and enter the QoS policy view. qos policy policy-name By default, no QoS policy exists. 3. Associate a class with a traffic behavior in the QoS policy. classifier tcl-name behavior behavior-name By default, no traffic behavior is associated with a class. NOTE: After the preceding configuration, you can use the display qos policy command in any view to display QoS policy configuration.
Step Command qos apply policy policy-name global { inbound | outbound } Apply a QoS policy globally. 2. Applying a QoS policy to the control plane You can apply a QoS policy to the control plane to mirror the traffic in a specific direction on all ports of the control plane. To apply a QoS policy to the control plane: Step 1. Command Enter system view. system-view • In standalone mode: 2. Enter control plane view.
Traffic mirroring configuration example Local traffic mirroring configuration example Network requirements As shown in Figure 61, different departments of a company use IP addresses on different subnets. The marketing and technical departments use the IP addresses on subnets 192.168.1.0/24 and 192.168.2.0/24, respectively. The working hour of the company is from 8:00 to 18:00 on weekdays.
# Create traffic behavior tech_b, configure the action of mirroring traffic to port Ten-GigabitEthernet 1/0/3. [DeviceA] traffic behavior tech_b [DeviceA-behavior-tech_b] mirror-to interface ten-gigabitethernet 1/0/3 [DeviceA-behavior-tech_b] quit # Create QoS policy tech_p, and associate traffic class tech_c with traffic behavior tech_b in the QoS policy.
system-view [DeviceA] acl number 2000 [DeviceA-acl-basic-2000] rule permit source 10.1.1.1 255.255.255.0 [DeviceA-acl-basic-2000] quit # Create class 1 and use basic IPv4 ACL 2000 as the match criteria. [DeviceA] traffic classifier 1 [DeviceA-classifier-1] if-match acl 2000 [DeviceA-classifier-1] quit # Create behavior 1 and configure the action of mirroring traffic to Ten-GigabitEthernet 1/0/1 for the behavior.
[DeviceB-Ten-GigabitEthernet1/0/2] port trunk permit vlan 2 3. Configure Device C: # Configure Ten-GigabitEthernet 1/0/1 as a trunk port and assign it to VLAN 2. system-view [DeviceC] interface Ten-GigabitEthernet 1/0/1 [DeviceC-Ten-GigabitEthernet1/0/1] port link-type trunk [DeviceC-Ten-GigabitEthernet1/0/1] port trunk permit vlan 2 [DeviceC-Ten-GigabitEthernet1/0/1] quit # Create remote source group 1. [DeviceC] mirroring-group 1 remote-destination # Create VLAN 2.
Configuring sFlow Sampled Flow (sFlow) is a traffic monitoring technology. As shown in Figure 63, the sFlow system involves an sFlow agent embedded in a device and a remote sFlow collector. The sFlow agent collects interface counter information and packet information and encapsulates the sampled information in sFlow packets. When the sFlow packet buffer is full, or the aging timer (fixed to 1 second) expires, the sFlow agent sends the packets in UDP datagrams to the specified sFlow collector.
Configuring the sFlow agent and sFlow collector information Step Enter system view. 1. (Optional.) Configure an IP address for the sFlow agent. 2. Command Remarks system-view N/A sflow agent { ip ip-address | ipv6 ipv6-address } By default, no IP address is configured for the sFlow agent. The device periodically checks whether the sFlow agent has an IP address. If not, the device automatically selects an IPv4 address for the sFlow agent but does not save the IPv4 address in the configuration file.
Step Command Remarks The default setting is random. 3. (Optional.) Set the flow sampling mode. sflow sampling-mode { determine | random } 4. Enable flow sampling and specify the number of packets out of which flow sampling samples a packet on the interface. sflow sampling-rate rate By default, flow sampling samples no packet. (Optional.) Set the maximum number of bytes of a packet (starting from the packet header) that flow sampling can copy.
sFlow configuration example Network requirements As shown in Figure 64, configure flow sampling in random mode and counter sampling on Ten-GigabitEthernet 1/0/1 of the device to monitor traffic on the port. Configure the device to send sampled information in sFlow packets through Ten-GigabitEthernet 1/0/3 to the sFlow collector. Figure 64 Network diagram Configuration procedure 1. Configure the IP addresses and subnet masks for interfaces, as shown in Figure 64. (Details not shown.) 2.
Verifying the configurations # Display the sFlow configuration and operation information. [Sysname-Ten-GigabitEthernet1/0/1] display sflow sFlow datagram version: 5 Global information: Agent IP: 3.3.3.1(CLI) Source address: Collector information: ID IP Port Aging Size VPN-instance Description 1 3.3.3.
Configuring samplers A sampler samples packets. The sampler selects a packet from among sequential packets, and it sends the packet to other service modules for processing. Sampling is useful when you want to limit the volume of traffic to be analyzed. The sampled data is statistically accurate and sampling decreases the impact on the forwarding capacity of the device. The following sampling modes are available: • Fixed mode—The first packet is selected from among sequential packets in each sampling.
Monitoring and maintaining processes HP Comware V7 is a full-featured, modular, and scalable network operating system based on the Linux kernel. Comware V7 software features run the following types of independent processes: • User process—Runs in user space. Most Comware V7 software features run user processes. Each process runs in an independent space so the failure of a process does not affect other processes. The system automatically monitors user processes.
For detailed information about the display memory [ chassis chassis-number slot slot-number ] command, see Fundamentals Command Reference. Displaying and maintaining user processes Execute display commands in any view and other commands in user view. In standalone mode: Task Command Display log information for all user processes. display process log [ slot slot-number ] Display memory usage for all user processes.
Task Command Display memory content starting from a specified memory block for a user process. display process memory heap job job-id address starting-address length memory-length [ chassis chassis-number slot slot-number ] Display context information for process exceptions. display exception context [ count value ] [ chassis chassis-number slot slot-number ] Display the core file directory.
Step 4. (Optional.) Disable kernel thread deadloop detection for a kernel thread. Command Remarks monitor kernel deadloop exclude-thread tid [ slot slot-number ] After enabled, kernel thread deadloop detection monitors all kernel threads by default. To configure kernel thread deadloop detection (in IRF mode): Step Command Remarks 1. Enter system view. system-view N/A 2. Enable kernel thread deadloop detection.
Step Command Remarks 1. Enter system view. system-view N/A 2. Enable kernel thread starvation detection. monitor kernel starvation enable [ chassis chassis-number slot slot-number ] By default, the function is disabled. 3. (Optional.) Set the interval for identifying a kernel thread starvation. monitor kernel starvation time interval [ chassis chassis-number slot slot-number ] The default is 120 seconds. (Optional.) Disable kernel thread starvation detection for a kernel thread.
Task Command Display kernel thread starvation information. display kernel starvation show-number [ offset ] [ verbose ] [ chassis chassis-number slot slot-number ] Display kernel thread starvation detection configuration. display kernel starvation configuration [ chassis chassis-number slot slot-number ] Clear kernel thread deadloop information. reset kernel deadloop [ chassis chassis-number slot slot-number ] Clear kernel thread exception information.
Configuring GOLD Generic Online Diagnostics (GOLD) runs diagnostic tests on a device to inspect device ports, RAM, chip, connectivity, forwarding paths, and control paths for hardware faults, and reports the problems to the system. GOLD monitoring diagnostics run diagnostic tests periodically when the system is in operation and record test results. Monitoring diagnostics only execute non-disruptive tests.
Simulating test results Test simulation verifies GOLD frame functionality. When you use the diagnostic simulation commands to simulate a diagnostic test, only part of the test code is executed to generate a test result. Test simulation does not trigger hardware correcting actions such as device restart and active and standby switchover. To simulate a test: Task Command Remarks Simulate a test (in standalone mode).
Task Command Display configurations for simulated tests (in standalone mode). display diagnostic simulation [ slot slot-number ] Display configurations for simulated tests (in IRF mode). display diagnostic simulation [ chassis chassis-number [ slot slot-number ] ] Clear GOLD logs. reset diagnostic event-log Clear test results (in standalone mode). reset diagnostic result [ slot slot-number [ test test-name ] ] Clear test results (in IRF mode).
#O/*: Ondemand test/NA #M/*: Monitoring test/NA #D/*: Disruptive test/Non-disruptive test #P/*: Per port test/NA #A/I/*: Monitoring test is active/Monitoring test is inactive/NA Slot 10: Test name : HGMonitor Test attributes : **M*PA Test interval : 00:01:00 Min interval : 00:00:10 Correct-action : -NA- Description ports. : A Real-time test, disabled by default that checks link status between # View the test result.
Test name : HGMonitor Test attributes : **M*PI Test interval : 00:00:10 Min interval : 00:00:10 Correct-action : -NA- Description ports. : A Real-time test, disabled by default that checks link status between # Enable test HGMonitor on card 10 of IRF member device 1. system-view [Sysname] diagnostic monitor enable chassis 1 slot 10 test HGMonitor # Set the execution interval to 1 minute.
Support and other resources Contacting HP For worldwide technical support information, see the HP support website: http://www.hp.
Conventions This section describes the conventions used in this documentation set. Command conventions Convention Description Boldface Bold text represents commands and keywords that you enter literally as shown. Italic Italic text represents arguments that you replace with actual values. [] Square brackets enclose syntax choices (keywords or arguments) that are optional. { x | y | ... } Braces enclose a set of required syntax choices separated by vertical bars, from which you select one.
Network topology icons Represents a generic network device, such as a router, switch, or firewall. Represents a routing-capable device, such as a router or Layer 3 switch. Represents a generic switch, such as a Layer 2 or Layer 3 switch, or a router that supports Layer 2 forwarding and other Layer 2 features. Represents an access controller, a unified wired-WLAN module, or the switching engine on a unified wired-WLAN switch. Represents an access point.
Index NMM port mirroring monitor port to remote probe VLAN, 159 A access control NMM NTP access control rights configuration, 18 associating NMM IPv6 NTP client/server association mode, 30 NMM IPv6 NTP multicast association mode (on switch), 40 NMM NTP peer ACL, 12 NMM NTP query ACL, 12 NMM IPv6 NTP symmetric active/passive association mode, 33 NMM NTP security, 12 NMM NTP server ACL, 12 NMM NTP association mode, 14 NMM NTP synchronization ACL, 12 NMM NTP broadcast association mode, 10, 16 NMM SNMP
NMM NQA client threshold monitoring, 98, 113 bidirectional NMM NQA client UDP echo operation, 107, 135 NMM port mirroring, 149 NMM NQA client UDP jitter operation, 105, 130 boot GOLD configuration, 193 NMM NQA client voice operation, 108, 136 GOLD configuration (distributed devices–in IRF mode), 196 NMM NQA client/Track collaboration function, 113, 142 GOLD configuration (distributed devices–in standalone mode), 195 NMM NQA enable, 100 NMM NQA operation, 100 broadcast NMM NTP multicast client co
NMM Layer 3 remote port mirroring, 161, 161, 170 NMM NQA client template optional parameters, 122 NMM Layer 3 remote port mirroring local group, 162 NMM NQA client threshold monitoring, 113 NMM NQA client UDP echo operation, 107, 135 NMM Layer 3 remote port mirroring local group monitor port, 164 NMM NQA client UDP jitter operation, 105, 130 NMM NQA client voice operation, 108, 136 NMM Layer 3 remote port mirroring local group source CPU, 163 NMM NQA client/Track collaboration, 142 NMM NQA client/Tra
NMM port mirroring remote destination group monitor port, 157 SNMPv2c, 83 NMM port mirroring remote destination group remote probe VLAN, 158 SNMPv2c basic parameters, 75 SNMPv2c agent notification, 80 SNMPv3, 85 NMM remote port mirroring destination group, 157 NMM remote port mirroring source group, 159 NMM remote port mirroring source group egress port, 160 NMM remote port mirroring source group remote probe VLAN, 161 NMM remote port mirroring source group source CPU, 160 NMM remote port mirroring sou
NMM system information hidden log output rules, 58 NMM local port mirroring configuration (source CPU mode), 166 NMM system information security log output rules, 58 NMM local port mirroring configuration (source port mode), 165 NMM system information trace log output rules, 58 NMM local port mirroring group monitor port, 154 NMM local port mirroring group source CPU, 153 destination NMM NTP architecture, 9 NMM information center system logs, 57 NMM NTP broadcast association mode (on switch), 35 N
NMM NQA client UDP echo operation, 107, 135 NMM NQA, 97 NMM NQA client DHCP operation, 101, 125 egress port diagnosing NMM Layer 2 remote port mirroring, 150 NMM Layer 2 remote port mirroring configuration, 168 NMM information center diagnostic log, 56 NMM information center diagnostic log file save, 66 NMM port mirroring remote source group egress port, 160 direction NMM port mirroring (bidirectional), 149 enabling NMM information center duplicate log suppression, 68 NMM port mirroring (inbound),
NMM sFlow configuration, 181, 181, 184 NMM RMON Ethernet statistics, 87 Sampled Flow.
inbound IP addressing tracert, 3, 4 NMM port mirroring, 149 tracert node failure identification, 4 information center configuration, 56, 61 IP services diagnostic log default output rules, 57 NMM NQA client DHCP operation, 101, 125 diagnostic log save to file, 66 NMM NQA client DLSw operation, 110, 139 displaying, 69 NMM NQA client DNS operation, 102, 126 duplicate log suppression, 68 NMM NQA client DNS template, 118, 145 FIPS compliance, 61 NMM NQA client FTP operation, 103, 128 hidden log
PMM, 189 GOLD log buffer size, 194 PMM deadloop detection, 189 NMM information center common logs, 56 PMM starvation detection, 190 NMM information center configuration, 56, 61 NMM information center diagnostic log save to file, 66 L Layer 2 NMM information center diagnostic logs, 56 NMM port mirroring configuration, 149 NMM information center duplicate log suppression, 68 NMM remote port mirroring, 157 NMM remote port mirroring configuration, 156, 168 NMM information center hidden logs, 56 NMM i
GOLD configuration (distributed devices–in standalone mode), 195 maintaining GOLD, 194 NMM information center, 69 GOLD monitoring diagnostics configuration, 193 PMM, 187 kernel thread PMM, 189 PMM kernel threads, 191 NMM NQA client threshold monitoring, 113 PMM Linux, 187 NMM NQA threshold monitoring, 98 PMM Linux, 187 process monitoring and maintenance. See PMM Management Information Base. Use MIB managing process monitoring and maintenance.
NMM Layer 3 remote port mirroring local group source CPU, 163 NMM NTP client/server mode authentication, 18 NMM Layer 3 remote port mirroring local group source port, 162 NMM NTP max number dynamic associations, 27 NMM local port mirroring configuration, 152 NMM NTP message source interface, 26 NMM NTP local clock as reference source, 28 NMM NTP message processing disable, 27 NMM local port mirroring group monitor port, 154 NMM NTP MPLS VPN support, 13 NMM NTP multicast association mode, 17 NMM loc
quality analyzer.
information center interface link up/link down log generation, 68 local port mirroring group source CPU, 153 information center log default output rules, 57 local port mirroring local group, 152 information center log destinations, 57 local traffic mirroring configuration, 174, 177 local port mirroring group source port, 153 information center log formats, 58 maintaining information center, 69 information center log levels, 56 NQA client DHCP operation, 101, 125 information center log output (con
NTP broadcast mode authentication configuration, 23 sampler configuration, 186 NTP broadcast mode with authentication (on switch), 45 sFlow agent configuration, 182 sampler creation, 186 sFlow collector information configuration, 182 NTP client/server association mode configuration, 29 sFlow configuration, 181, 181, 184 sFlow counter sampling configuration, 183 NTP client/server mode authentication configuration, 18 sFlow flow sampling configuration, 182 SNMP agent notification, 80 NTP client/serve
configuration, 97, 99, 124 traffic mirroring traffic behavior configuration, 174 displaying, 123 NMS HTTP operation, 129 NMM RMON alarm function configuration, 94 ICMP template configuration, 144 NMM RMON configuration, 87 operation types, 97 NMM RMON Ethernet statistics group configuration, 92 server configuration, 99 NMM RMON history group configuration, 93 Track collaboration function, 98 SNMP Get operation, 74 SNMP Notification operation, 74 threshold monitoring, 98 NTP access control, 12
NMM information center synchronous log output, 67 message processing disable, 27 message source interface specification, 26 MPLS VPN support, 13 NMM information logs to console, 62, 69 multicast association mode, 10 NMM information logs to log host, 63 NMM information logs to monitor terminal, 62 multicast association mode configuration, 17 multicast association mode configuration (on switch), 37 multicast client configuration, 17 P packet configuring remote traffic mirroring, 178 multicast mode auth
NMM NTP optional parameter configuration, 26 NMM NTP broadcast association mode (on switch), 35 SNMP basic parameter configuration, 74 NMM NTP broadcast mode with authentication (on switch), 45 SNMPv1 basic parameter configuration, 75 NMM NTP client/server association mode, 29 SNMPv2c basic parameter configuration, 75 SNMPv3 basic parameter configuration, 76 NMM NTP client/server mode with authentication, 43 NMM NQA client path jitter operation, 111, 140 NMM NTP client/server mode with MPLS VPN tim
local group source port configuration restrictions, 153 configuring local traffic mirroring, 173 local mirroring configuration (source CPU mode), 166 configuring NMM information center, 61 configuring NMM client NQA DNS operation, 126 configuring NMM information center trace log file, 67 local mirroring configuration (source port mode), 165 configuring NMM IPv6 NTP client/server association mode, 30 mirroring group, 149 monitor port to remote probe VLAN assignment, 159 configuring NMM IPv6 NTP multi
configuring NMM NQA client history record save, 116 configuring NMM NTP broadcast association mode (on switch), 35 configuring NMM NQA client HTTP operation, 104, 129 configuring NMM NTP broadcast client, 16 configuring NMM NTP broadcast mode authentication, 23 configuring NMM NQA client HTTP template, 120, 146 configuring NMM NTP broadcast mode with authentication (on switch), 45 configuring NMM NQA client ICMP echo operation, 101, 124 configuring NMM NTP broadcast server, 16 configuring NMM NQA cl
configuring NMM port mirroring remote source group egress port, 160 configuring SNMPv1 basic parameters, 75 configuring SNMPv2c, 83 configuring NMM port mirroring remote source group on source device, 159 configuring SNMPv2c agent notification, 80 configuring SNMPv2c basic parameters, 75 configuring NMM port mirroring remote source group remote probe VLAN, 161 configuring SNMPv3, 85 configuring SNMPv3 agent notification, 80 configuring NMM port mirroring remote source group source CPU, 160 configurin
maintaining NMM information center, 69 NMM local traffic mirroring configuration, 174, 177 maintaining PMM, 187 NMM traffic mirroring configuration, 173, 177 maintaining PMM kernel threads, 191 NMM traffic mirroring match criteria configuration, 174 managing NMM information center security log, 65 NMM traffic mirroring QoS policy application, 175 managing NMM information center security log file, 65 NMM traffic mirroring QoS policy application (control plane), 176 monitoring kernel thread (PMM), 1
remote source group remote probe VLAN configuration, 161 remote source group source CPU, 160 statistics function configuration, 89 routing NMM IPv6 NTP client/server association mode, 30 remote source group source ports, 159 NMM IPv6 NTP multicast association mode (on switch), 40 remote probe VLAN enabling port mirroring multiple monitor ports, 155 NMM IPv6 NTP symmetric active/passive association mode, 33 NMM Layer 2 remote port mirroring, 150 NMM NTP association mode, 14 NMM port mirroring monitor
Sampled Flow. Use saving troubleshooting remote collector cannot receive packets, 185 NMM information center diagnostic logs to file, 66 Simple Network Management Protocol. Use NMM information center log to log file, 64 simulating Simplified NTP.
NMM information center duplicate log suppression, 68 configuration, 83 Notification operation, 74 protocol version, 74 switch module debug, 6 SNMPv3 agent notification, 80 NMM IPv6 NTP multicast association mode, 40 basic parameter configuration, 76 NMM NTP broadcast association mode, 35 NMM NTP broadcast mode with authentication, 45 configuration, 85 NMM NTP client/server mode with MPLS VPN time synchronization, 48 Notification operation, 74 protocol version, 74 NMM NTP multicast association mode
NMM information center log output (log host), 63 NMM information center log output (monitor terminal), 62 ping network connectivity test, 1 threshold NMM NQA client threshold monitoring, 98, 113 NMM NQA operation reaction entry, 114 NMM information center log output (UNIX log host), 70 NMM NQA operation support accumulate type, 113 NMM information center log save to file, 64 NMM NQA operation support average type, 113 NMM information center security log file management, 65 NMM NQA operation support c
NMM NTP broadcast mode with authentication (on switch), 45 traffic mirroring configuration, 173, 177 configuring remote, 178 NMM NTP client/server association mode, 29 local, 173 NMM NTP client/server mode with authentication, 43 local configuration, 174, 177 NMM NTP client/server mode with MPLS VPN time synchronization (on switch), 48 match criteria configuration, 174 QoS policy application, 175 NMM NTP configuration, 8, 14 QoS policy application (control plane), 176 NMM NTP multicast association