
R21xx-HP FlexFabric 11900 Network Management and Monitoring Command Reference


172
Commands Descri
p
tion
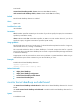
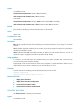
< Moves sort field to the next left column.
> Moves sort field to the next right column.
Examples
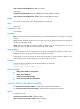
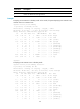
# Display process statistics in dumbtty mode. In this mode, the system displays process statistics once,
and then returns to command view.
<Sysname> monitor process dumbtty
76 processes; 103 threads; 687 fds
Thread states: 1 running, 102 sleeping, 0 stopped, 0 zombie
CPU states: 77.16% idle, 0.00% user, 14.96% kernel, 7.87% interrupt
Memory: 496M total, 341M available, page size 4K
JID PID PRI State FDs MEM HH:MM:SS CPU Name
1047 1047 120 R 9 1420K 00:02:23 13.53% diagd
1 1 120 S 17 1092K 00:00:20 7.61% scmd
1000 1000 115 S 0 0K 00:00:09 0.84% [sock/1]
1026 1026 120 S 20 26044K 00:00:05 0.84% syslogd
2 2 115 S 0 0K 00:00:00 0.00% [kthreadd]
3 3 99 S 0 0K 00:00:00 0.00% [migration/0]
4 4 115 S 0 0K 00:00:06 0.00% [ksoftirqd/0]
5 5 99 S 0 0K 00:00:00 0.00% [watchdog/0]
6 6 115 S 0 0K 00:00:01 0.00% [events/0]
7 7 115 S 0 0K 00:00:00 0.00% [khelper]
4797 4797 120 S 8 28832K 00:00:02 0.00% comsh
5117 5117 120 S 8 1496K 00:00:00 0.00% top
<Sysname>
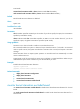
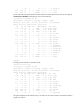
# Display process statistics twice in dumbtty mode.
<Sysname> monitor process dumbtty iteration 2
76 processes; 103 threads; 687 fds
Thread states: 1 running, 102 sleeping, 0 stopped, 0 zombie
CPU states: 44.84% idle, 0.51% user, 39.17% kernel, 15.46% interrupt
Memory: 496M total, 341M available, page size 4K
JID PID PRI State FDs MEM HH:MM:SS CPU Name
1047 1047 120 R 9 1420K 00:02:30 37.11% diagd
1 1 120 S 17 1092K 00:00:21 11.34% scmd
1000 1000 115 S 0 0K 00:00:09 2.06% [sock/1]
1026 1026 120 S 20 26044K 00:00:05 1.54% syslogd
1027 1027 120 S 12 9280K 00:01:12 1.03% devd
4 4 115 S 0 0K 00:00:06 0.51% [ksoftirqd/0]
1009 1009 115 S 0 0K 00:00:08 0.51% [karp/1]
1010 1010 115 S 0 0K 00:00:13 0.51% [kND/1]
5373 5373 120 S 8 1496K 00:00:00 0.51% top
2 2 115 S 0 0K 00:00:00 0.00% [kthreadd]
3 3 99 S 0 0K 00:00:00 0.00% [migration/0]
5 5 99 S 0 0K 00:00:00 0.00% [watchdog/0]
6 6 115 S 0 0K 00:00:01 0.00% [events/0]